For the last four years, maybe eight years, I have assumed that the green camp’s base of voters was bigger than the blue camp’s. For most of this period, the DPP has had significantly higher party ID than the KMT. President Tsai has not always had fantastic approval ratings, but they have usually been at least decent. Most importantly, roughly twice as many people identify as Taiwanese and as both Taiwanese and Chinese, and this sense of national identity is the bedrock that the party system is built on. That didn’t mean the blue camp could never win. Candidate quality matters, issues matter, scandals matter, and all kinds of other things can matter. Unexpected things can always happen. However, it meant that the blue camp was always running uphill, while the green camp was always running downhill. All things equal, it was more likely that the DPP would win a contest than the KMT.
Recent surveys have made me question whether the KMT is successfully overcoming those structural disadvantages during this campaign. I’m no longer sure the the green camp is larger today than the blue camp.
I wrote a post a couple of months ago speculating on whether the DPP’s advantage was eroding a bit. The main evidence for this possibility came from Formosa polls, which asked whether respondents had good feelings or bad feelings toward the KMT and DPP. I like this question because it tells you something about the political preferences of a large group of people who won’t answer a traditional party ID question. In the traditional party ID question, around 30 to 40% will not give an answer. The percentage of non-responses in these questions about good or bad feelings towards parties is only about half that much, and sometimes even less.
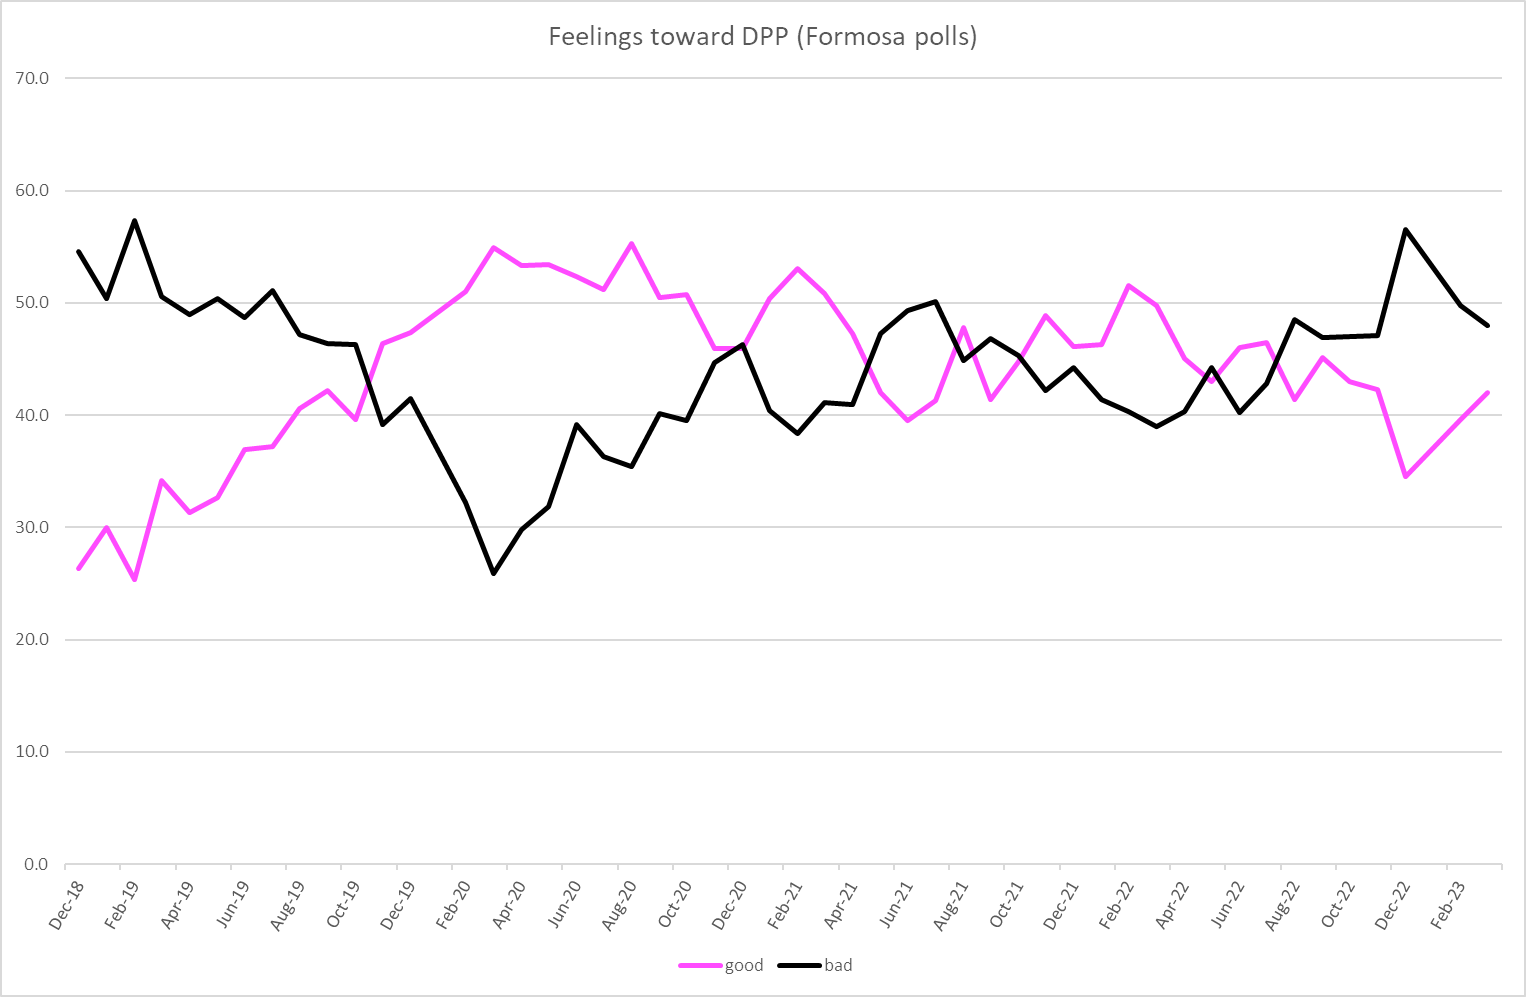
The DPP enjoyed an enormous advantage on this question in 2020 and 2021, and a smaller but still clear advantage in 2022 and most of 2023. However, in the September survey their advantage shrunk dramatically. They still maintained an advantage in party ID, but this question about feelings looked like a red flag to me. It was something I wanted to keep an eye on.
Since that post came out, we have gotten the October and November Formosa surveys. There wasn’t very much in them to make the DPP feel cheerful. October was particularly bad for the DPP. While it bounced back a bit in November, the KMT continued to improve.
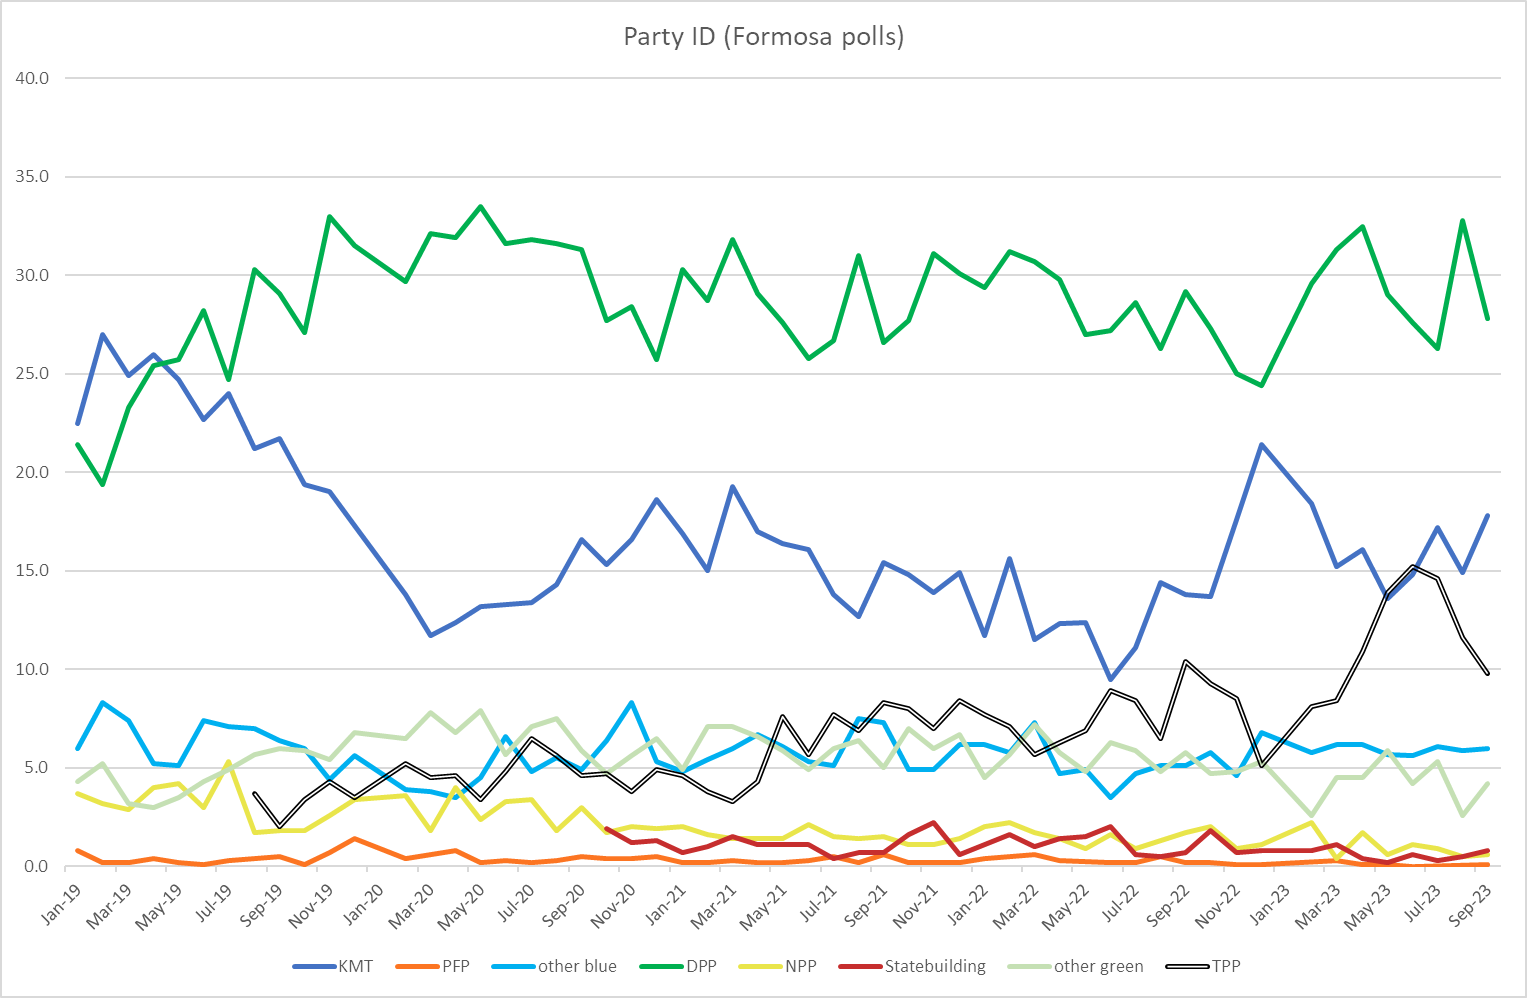
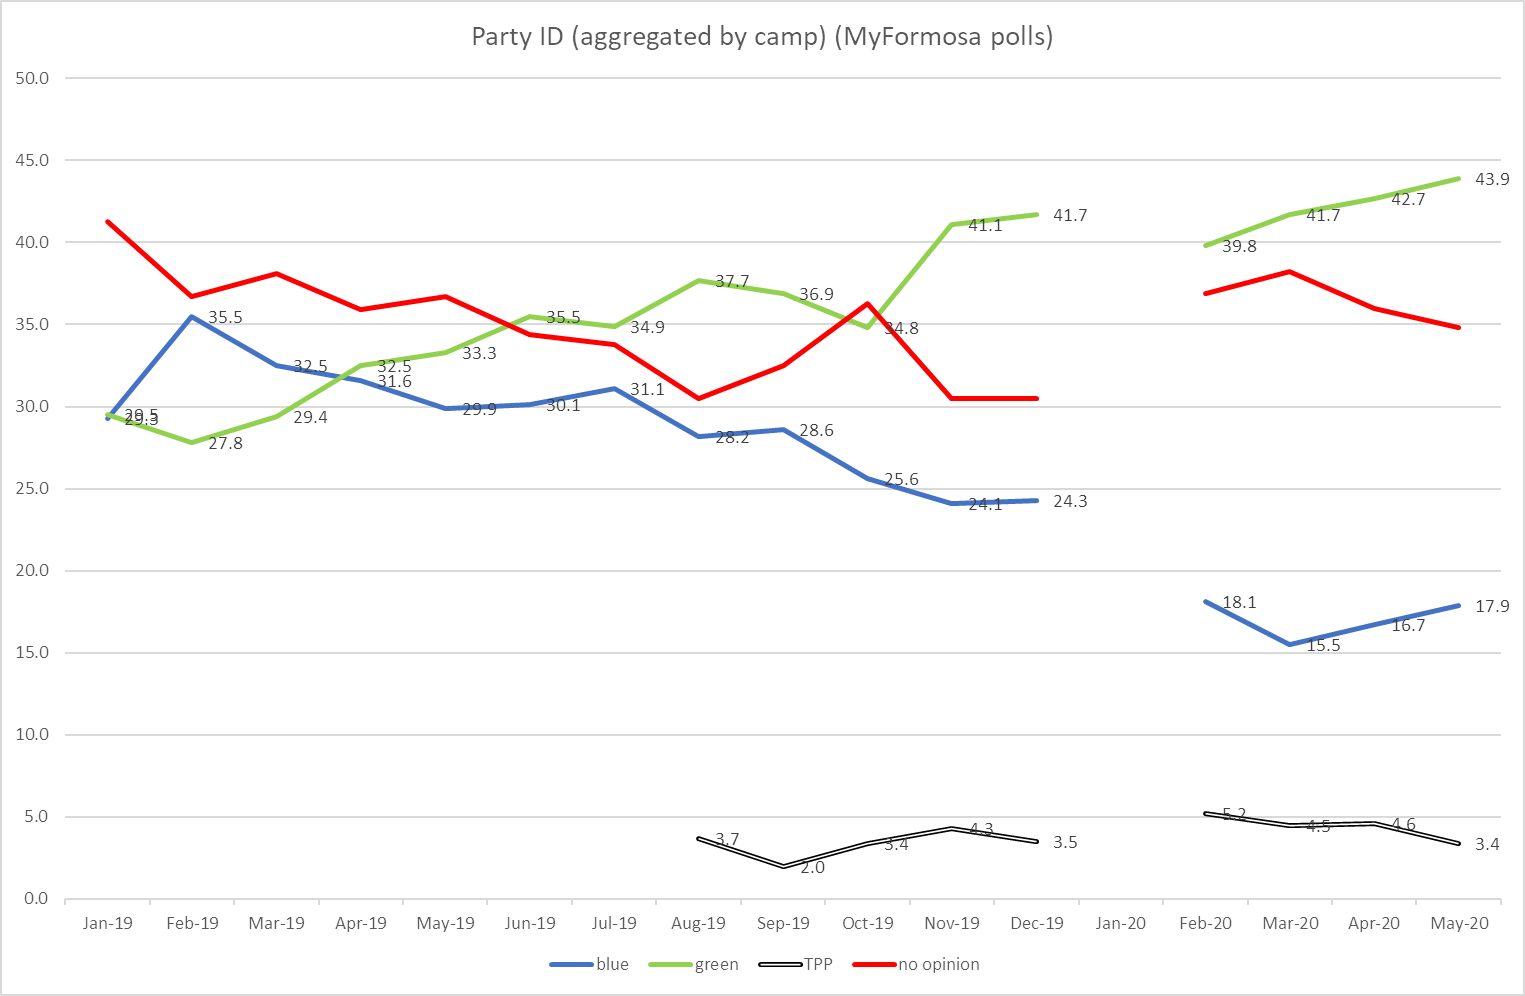
In the post after the September survey, I noted that party ID had been fairly stable. That is no longer the case. For most of the year, the DPP has maintained a 10 to 15% advantage over the KMT in party ID. After these two months, the KMT has climbed to 24.0%, its highest point in this survey since before Tsai’s reelection. With the DPP at 29.9%, the gap between the two parties is only 5.9%.
But wait, there is one more party to consider. The TPP has gotten 12% in the last two surveys, which isn’t quite as high as the 14 or 15% it was getting in the summer but is still a substantial amount. Those respondents will probably vote for Ko in the presidential election, but most of the legislative races will be one-on-one KMT versus DPP contests, and they will probably break predominantly for the KMT. You never get 100% of a group doing the same thing, but it could be enough of the TPP supporters voting for the KMT that the party ID figures indicate a tied contest or even a slight KMT advantage.
The trends in the questions about feelings towards parties are equally dramatic. After the September survey, I took notice because the DPP’s usual net advantage of 20% or so had been cut in half to only 10.1%. In October, that DPP advantage disappeared altogether, becoming a KMT net advantage of 3.9%. The two sides regressed a little bit towards their previous patterns in November so that the DPP eked out a tiny 1.1% net advantage. Essentially, the advantage they held on this question for three and a half years is now completely gone. The number of voters sympathetic (or antagonistic) to the blue camp is almost the same has the number of voters sympathetic (or antagonistic) to the green camp.
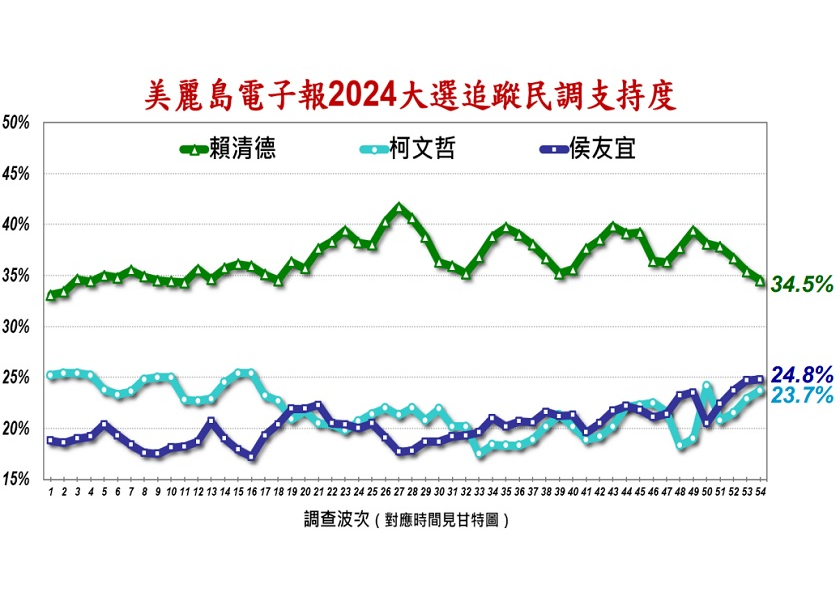
What do these numbers mean in terms of electoral outcomes? The November Formosa survey gives a fairly common (during this last week) picture of the presidential race, with Lai at 36.6%, Hou at 30.5%, and Ko at 17.7%. Lai is still the favorite, but it’s certainly not a sure thing.
What we don’t see as often are numbers for the legislative races. The Formosa survey shows a slight edge for the KMT. In the district races, 32.1% say they will vote for the KMT, 29.5% for the DPP, and 7.5% for the TPP. In the party list races, 33.2% say they will vote for the KMT, 29.6% for the DPP, and 13.3% for the TPP. There’s a lot that goes into determining who wins how many seats beyond just the national vote totals. However, if those are the national vote totals, it looks to me like the most likely outcomes are either a hung parliament in which the TPP holds the balance of power or an outright KMT majority.
All the standard caveats apply. No one has voted yet, and no one has won anything yet. There are still 40 days to go, and lots of things will happen between now and Election Day. From one point of view, you might expect things to improve for the DPP. After all, it should be easier for the DPP to win back voters who have been sympathetic to it in the past than for the KMT to reach even further into the pool of voters who have usually voted DPP for the last decade. However, there’s no guarantee things will work out that way. The KMT has been running uphill all this time while the DPP has been running downhill, and here they are running neck and neck. It might be that eight years of fatigue with the DPP government outweigh the structural advantages of national identity this year.
I haven’t taken a step back to look at the general state of public opinion and the presidential race in several months, so I thought I would do that today.
During the first few years of president Tsai’s second term, the trend was stark. The DPP was quite popular and the KMT’s reputation was dismal. A lot of that was due to the response to the pandemic, but just like in the rest of the world, the pandemic is now old news. No one wants to hear about how well the government handled COVID-19. Democratic elections are usually a question of “what have you done for me lately?” Opposition parties can always find something to criticize, and Taiwan is no different. Not surprisingly, party popularity today doesn’t look very much like party popularity in 2020 or 2021.
It is the case that the DPP is still the most popular party, and Lai is still leading in almost all presidential polls. The numbers have been quite stable for the last two years or so. However, if you look at the data more carefully, there are indications the DPP’s position might not be as solid as it looks at first glance.
As usual, I will be relying on Formosa polls. They repeatedly ask the same questions and publish detailed results in a standardized format. They do not selectively choose a few attention-grabbing results and focus all their attention on those or present the PowerPoint with some but not all of their results. When Formosa wants to highlight a particular result, they write a separate article and publish it separately. I wish other pollsters in Taiwan would follow their example.
However, it is worth noting that the Formosa polls produce slightly different results from many other polls. Generally speaking, Formosa shows Lai to be a little bit stronger than other polls, and Hou to be tied with or even slightly ahead of Ko whereas other polls generally show Ko with a slight lead over Hou. This difference could be due to the fact that Formosa only calls landlines. While they weight their data so that the sample represents the entire population by age, weighting only works if the people you interview are like the people you don’t interview. That may not be the case in current polling. There is a good argument that a representative sample must blend landlines and cell phones. On the other hand, it could also be the case many of the other polls are using junk methodology (such as polling by text messaging or dodgy internet sampling), and those results are not worth thinking about. The polls I trust the most are the ones we do at the Election Study Center at NCCU, and the ESC calls both landlines and cell phones. Unfortunately, ESC does not release up-to-the-minute data about the electoral horse race or even the popularity of parties. However, it is worth noting that if you go back several months and look at the party ID numbers reported in other polls, the Formosa results look more like the ESC results than many of the other pollsters who call both cell phones and landlines. Nonetheless, it is good to remember that the Formosa polls do not necessarily represent the mainstream conventional wisdom about the state of the race. Donovan Smith has put together a weighted polling average (similar to what I did four years ago) of various presidential polls, and you can see that the results are slightly different from the Formosa results.
(Aside: Since Taiwan News is no longer a dominant English-language media source for info on Taiwan, you might not be aware of Donovan’s excellent work. Donovan has done a tremendous job of reporting all the twists and turns of the election this year. If you haven’t been following him, you should go to the Taiwan News website. and search for his name (Courtney Donovan Smith). You could do a lot worse things with your time than spending a few hours reading everything he’s written this year.)
Formosa is currently doing two different series of polls. They do a monthly poll on the general state of politics. This is the poll that has been going on since December 2018, and I have discussed it many times in the past. In addition, they are also doing a rolling sample on the presidential race. Every day since mid-July (except on weekends and holidays) they do 400 interviews, and they combined the most recent three days to get a sample size of 1200. This means that each day is 2/3 the same sample as the previous day, but every three days there is an entirely new sample.
A look at the monthly polls shows only a few big shifts over the past year. Lai has consistently had about 35%. He’s gone up and down a little bit, but for the most part, he has been very steady. The first big shift was right after last year’s local elections when Hou surged in popularity. He was 5% ahead of Lai in the December 2022 poll, and this seems to have been the critical period in which the KMT decided that Hou was going to be their presidential candidate. After all, he had just smashed the DPP in local elections, and he looked like a potential winner in the presidential race. In addition, none of the other KMT figures who wanted to run for president (read: Chu) had similarly high polling numbers. Unfortunately for the KMT, Hou’s high polling numbers proved to be ephemeral. For most of the first half of 2023, he was consistently in the high 20s and clearly behind Lai. Nevertheless, he was in second place solidly ahead of Ko, who was consistently around 20%. The race in April 2023 looked a lot like it had looked in the summer of 2022.
Things shifted dramatically in May 2023 when Ko suddenly rose from trailing Hou by 4% in the April to leading by him by 8%. The main numbers were shocking to everyone, but numerous subsequent polls confirmed the change in the pecking order. After May, Ko was in second place. Hou had been relegated to third, which I need not remind you is a terrible place to be in a three-way race. Since that shock in May, the KMT campaign has been all about trying to consolidate their traditional base. Hou has wholeheartedly embraced almost all of the policies from former president Ma and has not made many overtures to the non-KMT sympathizers who powered his erstwhile high polling numbers. The KMT has made a certain amount of headway in this regard. The September 2023 poll showed Hou and Ko basically tied, though this is due as much to a drop in Ko’s support as it is to a rise in Hou’s.
Again, it is worth remembering that the Formosa polls are generally more favorable to Hou that other polls. Most other polls still show Ko in second place, though not always by a large margin.
The daily tracking polls tell basically the same story. Lai has usually been around 35%, sometimes as much as 40%. Since about mid-August, Hou and Ko have been jockeying for second place with neither one clearly having an advantage.
The most recent data (#54 was conducted Oct 16-18) shows somewhat better results for the blue camp a bit worse for the green camp. I’ll keep my eye on that to see if that’s a real trend or just a statistical blip.
Overall, it has been a fairly stable race. No one has skyrocketed upward or plummeted downward. Most shifts have been within a few percentage points of the previous poll.
The party ID numbers look fairly stable, too. Over the last four years, the DPP has usually had between 25 and 30% support. The KMT has gone up and down a little bit more, but it has generally been somewhere around 15 to 20%. The biggest change has been for the TPP, which did not exist five years ago. The TPP is slowly built its support to about 10%. In May, when Ko surged in the polls, the TPP also surged up to about 15%. However, as Ko has slid back to his previous levels, so has the TPP.
I keep talking about stability, but there is one number that gives me pause. In its monthly polls, Formosa asks respondents how they feel about the two major parties: Do they have good feelings or bad feelings toward each of the parties? Over the past several years (with the exception of the two months around the 2022 local elections), the DPP has consistently done much better than the KMT on these questions. For example, in March 2022, 49.8% had good feelings toward the DPP while 39.0% had bad feelings, a net positive rating of 10.8%. Meanwhile, 26.2% had good feelings toward the KMT while 59.0% had bad feelings, a net positive rating of -32.8%. Taken together, DPP had a 43.6% overall advantage on this question that month, one of four consecutive months in which the DPP had at least a 40% advantage. For most of 2023, the DPP’s advantage has been around 20%.
The September numbers are different. In August the DPP had a 27.0% advantage. In September, that shrank to only 10.1%. For perspective, the DPP net advantage in December 2019, the last monthly survey before the last national general election, was 34.7%. The difference didn’t come from the DPP numbers. The DPP has had net favorability rating of negative 2 or 3%for several months. However, the KMT went from a net favorability rating of -28.5% to only -13.2%. Only 48.4% of respondents expressed negative feelings towards the KMT. Other than the two months around the 2022 election, that’s the lowest negative percentage of negative feelings towards the KMT since April 2019, which was still in the heyday of the Han Wave. Apparently, something has shifted so that the population doesn’t have nearly as negative feelings towards the KMT as it previously did.
Why am I taking this number seriously and not just treating it as a probable statistical blip the way I normally treat unusual results? The thing is, the rest of this poll makes it clear that this wasn’t simply the result of a particularly good sample for the KMT. The KMT had some encouraging numbers, but the magnitude of this one stands out. Moreover, 40.0% of the respondents supported Lai in the presidential race, near the upper end of his usual range. This isn’t at all like those two months in late2022 where ALL the numbers were fantastic for the KMT and terrible for the DPP. If the presidential race were closer – as it was in the most recent tracking poll – you have to wonder whether the DPP’s longstanding advantage in emotional reactions would shrink even more.
These gut feelings probably don’t matter much for the portion of the electorate that has strong preferences. The people who can tell you which party they prefer or have clear preferences on specific policies will probably end up voting for who the side they have always supported. It’s the people without strong preferences who might matter. They are more likely to vote with their gut, and if their gut feelings are strongly negative about one of the two major parties, as they probably were in 2020 against Han and the KMT, they are likely to break solidly for the other side. In a more neutral environment, as 2024 seems to be, the DPP probably shouldn’t assume neutral voters will break so clearly for them again.
This might not matter in the presidential race, which seems on a solid path to a three-way race and a split opposition. However, it might be very important in many of the legislative races where the DPP won many marginal districts four years ago.
I’ve been very busy in my personal life and with my academic projects over the last few months, so I haven’t written much since the election. I thought it might be a good time to look at how public opinion has evolved since then before I try taking a swing at more current topics, such as the presidential race or Ma Ying-jeou’s visit to China.
To make a short story short, after the KMT’s smashing victory and the DPP’s enormous loss in November, there was a clear surge in support for the KMT and decline for the DPP. However, that shift was temporary, and it has now pretty much evaporated. The election seems not to have heralded any lasting change in partisan support.
In indicator after indicator, we see the same pattern. Survey results in the two months after the election (late November and December) look great for the KMT. By February and March, the KMT’s post-election bump is mostly gone. (Formosa didn’t do a January poll because of the lunar new year holiday.)
Exhibit A is party ID. For most of the past two years, the DPP has been around 30% while the KMT has been around 15%. In December 2022, the DPP fell to 24.4% and the KMT rose to 21.4%, only a 3% difference. It looked like the KMT was making real inroads. Fast forward to March 2023, and the DPP has 31.3% while the KMT has fallen back to 15.2%. It’s like the election never happened.
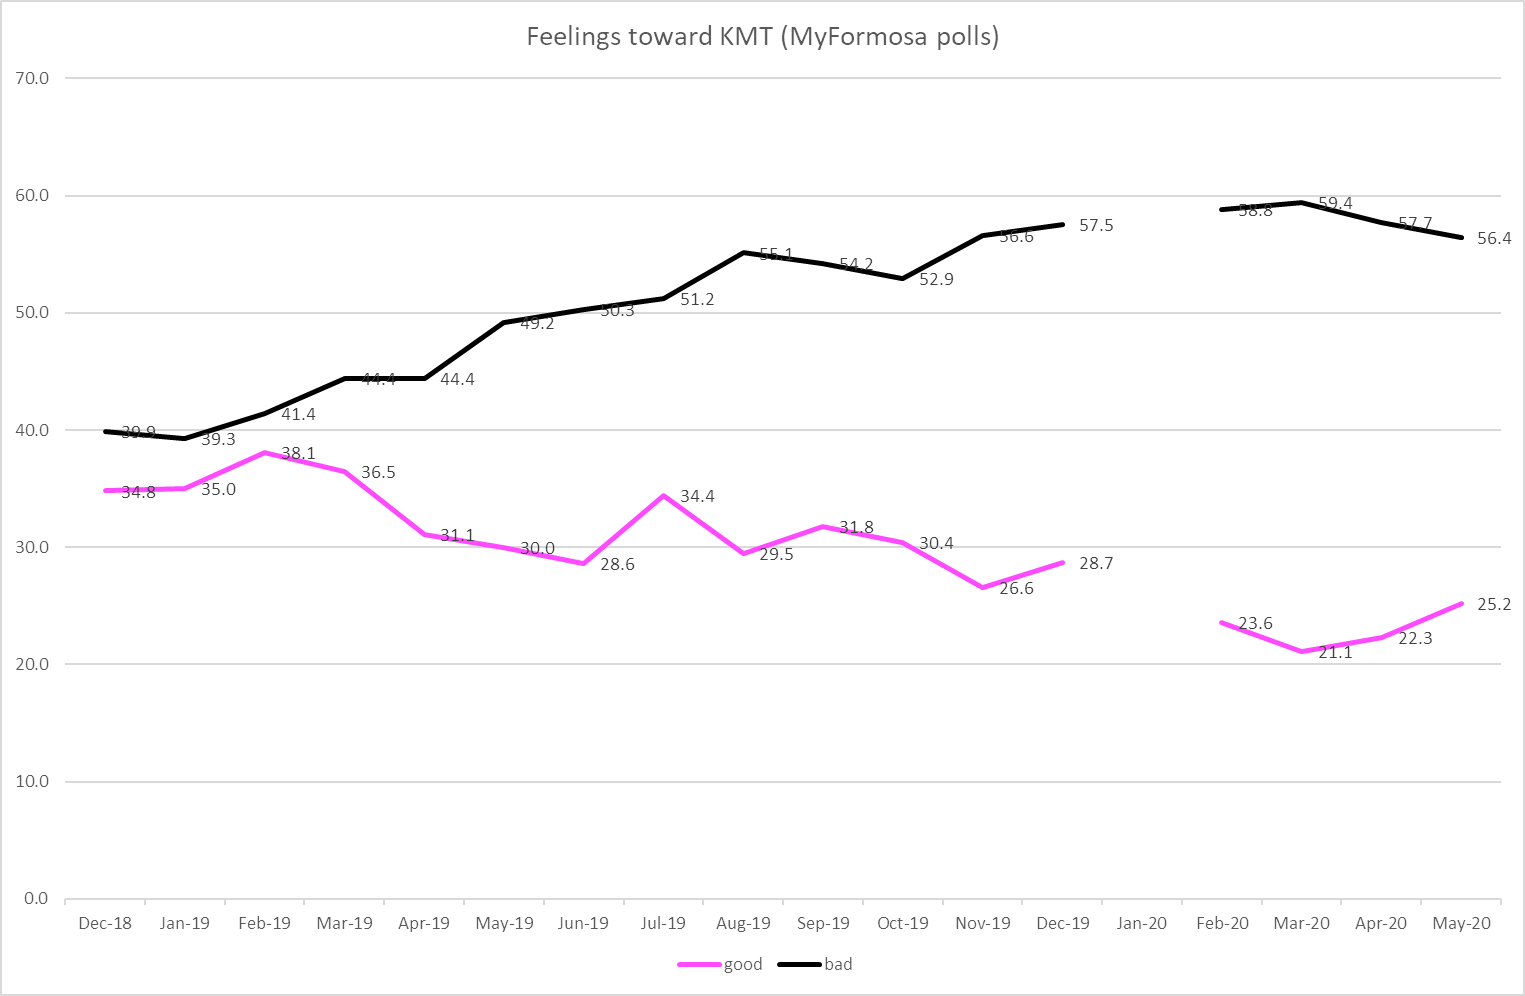
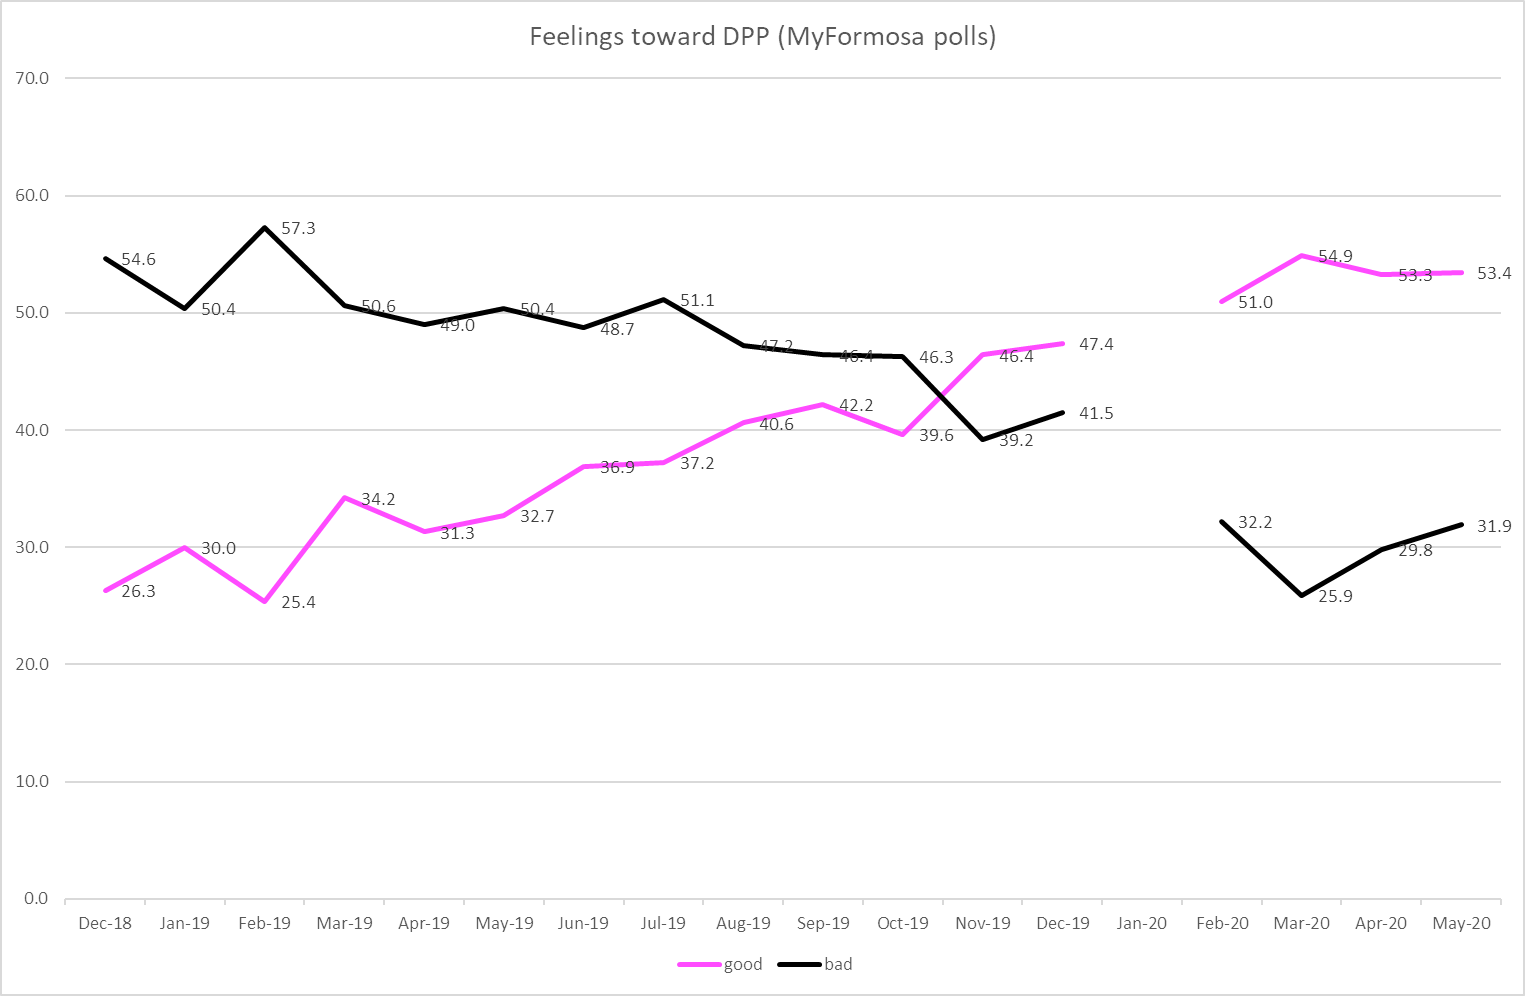
Exhibit B is good or bad feelings to the two big parties. Over the past two years, the KMT has usually had good feelings in the high 20s and bad feelings in the high 50s. In December, that gap shrunk to 6.6% (39.7% good, 46.3% bad). Great! But by March, we were right back where we started: 28.6% had good feelings toward the KMT and 57.7% had bad feelings.
Feelings toward the DPP are slightly different. We see the same basic pattern of slump and recovery, but the recovery is not so complete. Good feelings had mostly been in the high 40s and bad feelings in the low 40s. In March, that is reversed (42.0% good; 48.0% bad). It’s am improvement from December’s lousy numbers, but it isn’t all the way back.
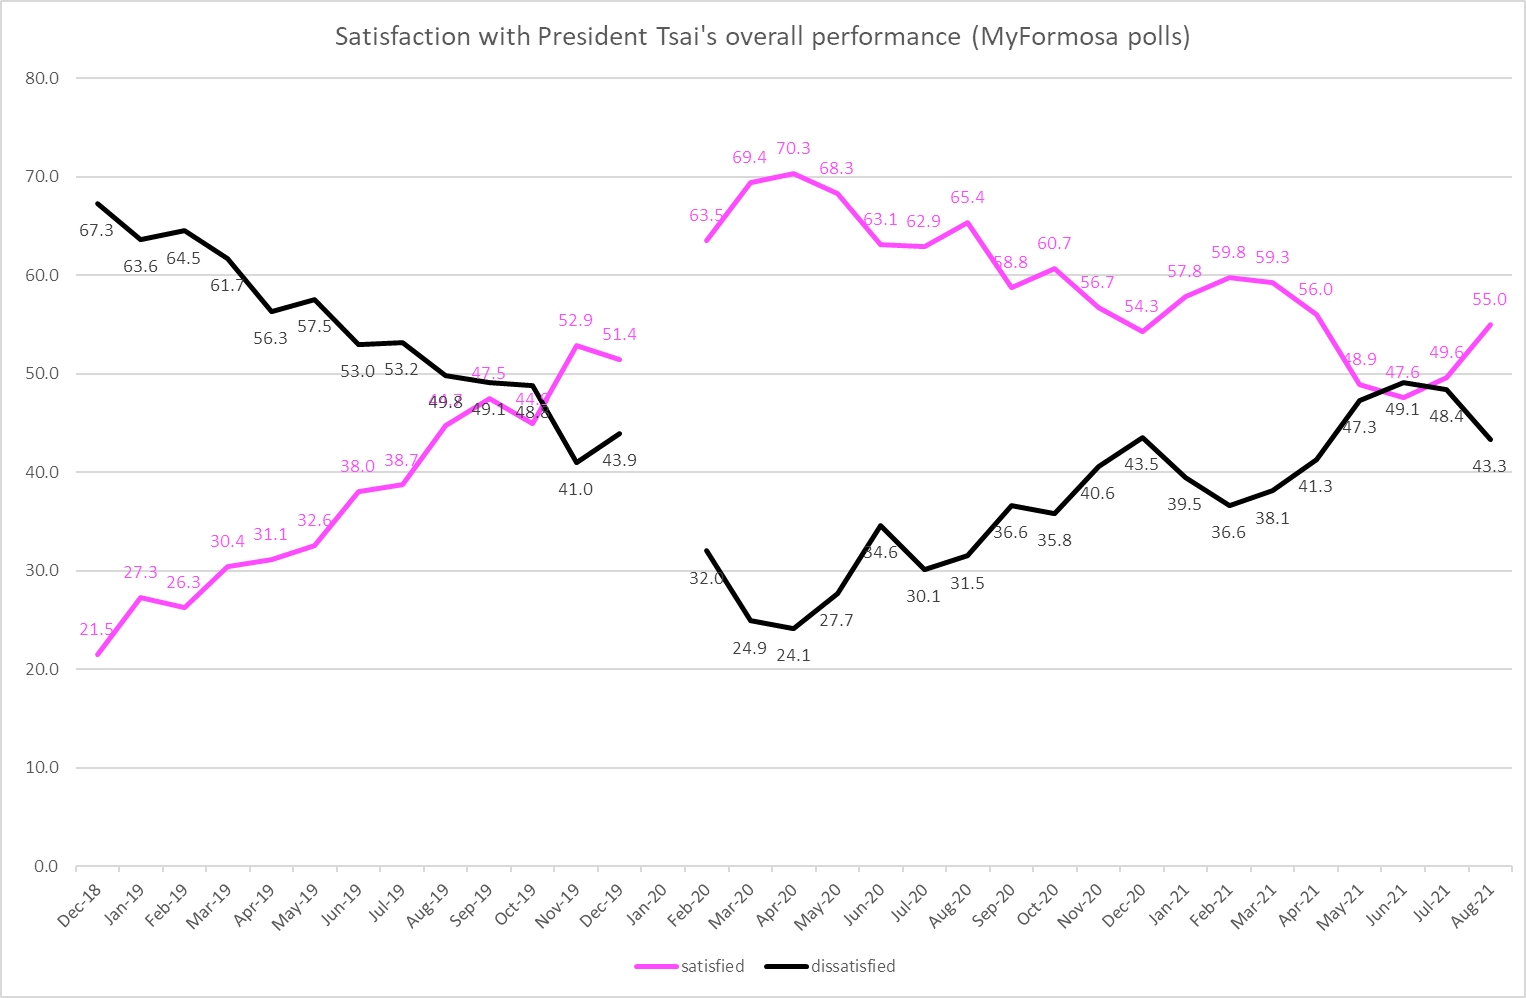
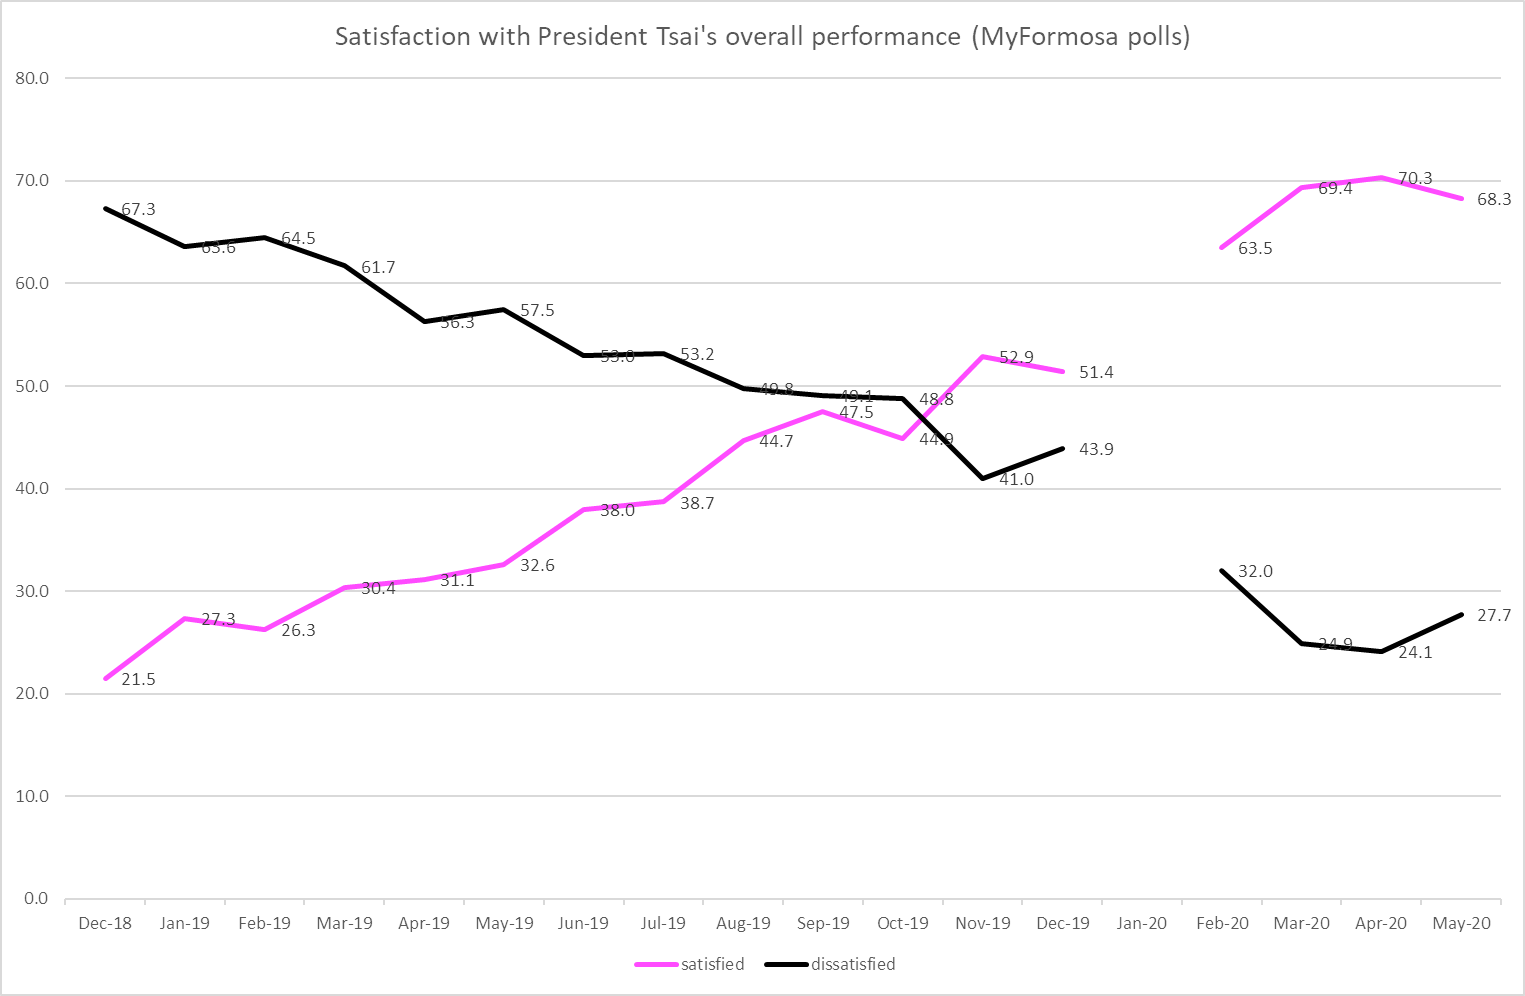
For Exhibit C, we turn to President Tsai’s approval ratings. Between April and September 2022 (ie: the period when Covid finally came into Taiwan in full force), Tsai’s satisfaction ratings were usually around 5 points net positive. In December by contrast, she was nearly 20 points under water (38.9% satisfied, 58.2% dissatisfied). That’s quite a shift. By March, there was a clear reversion. Tsai was nearly even (47.6% satisfied; 49.2% dissatisfied. While it wasn’t quite as good as the previous baseline, it was close.
What do I think was driving this KMT surge and retreat / DPP fall and recovery? I believe it has to do with the election. However, I don’t think it reflects any fundamental changes in how the public thinks about each party’s platform or leaders. Rather, I think these shifts are more likely the result of post-hoc reasoning by a slice of the electorate. Imagine a person who isn’t that engaged in politics and doesn’t have solid opinions set in stone. The DPP just had a terrible election. It’s not unreasonable for our respondent to conclude that they must be doing something wrong to have produced this terrible result. President Tsai, as the party leader, must likewise be doing a poor job. The same logic in reverse applies to the KMT. They must be doing something right. If you are judging the parties in the aftermath of the election based on the election results, it’s quite natural to be upset with the DPP or to think that maybe the KMT maybe is better than you thought. However, as the election fades from the headlines and you start to evaluate the parties on other (normal) criteria, we might expect the post-election bump to fade away.
About a month ago, I started writing a post about the August My Formosa poll. It was not a good poll for President Tsai and the DPP. Given that Nancy Pelosi’s visit occurred in early August, I thought it was important to address this. To make a long story short, I don’t think Pelosi’s visit or cross-straits politics were driving the dip in President Tsai’s popularity. The My Formosa poll didn’t ask anything about that, but two other polls did. Both showed that the public generally approved of Pelosi’s visit. Instead, the dip seemed to be driven by purely domestic events. The most obvious thing was the plagiarism scandal that forced the DPP’s candidate for Taoyuan mayor to withdraw from the race, but there have been a few other things as well.
Unfortunately, I got distracted by other things, and I never got around to finishing that post. One of my conclusions was going to be that we should probably wait for more data to come out to see if August was a lasting change or just a blip in the long-term trends. Well, now the September survey is out. Tsai and the DPP have bounced back a little, though not all the way.
For the purposes of getting this post out as quickly as possible, I’m going to copy my draft from a month ago (denoted in blue), and I will add a few comments to update things for this month.
August was an important month in Taiwan. Speaker Pelosi visited, China reacted by holding unprecedented military drills that redefined the status quo, Senator Markey visited and China continued its drills, and Senator Blackburn visited and China apparently got tired of complaining. The KMT reacted to this by sending a delegation to China, a move that was criticized by KMT politicians as well as everyone else. So what effects did these BIG EVENTS have on Taiwanese public opinion?
The August My Formosa poll is out, and President Tsai and the DPP did not do well. The talking heads are not being subtle. I heard the words “collapse” and “crisis” screamed several times.
Before you jump to any conclusions, you should keep in mind two things. First, it wasn’t a good poll for Tsai and the DPP, but “collapse” and “crisis” are overstating things juuust a bit. President Tsai has had several months this bad during her second term, including one earlier this year. And “bad” puts her at a level that Presidents Chen and Ma would have salivated at during their second terms. Second, the primary driver in the DPP’s decrease in popularity in August may not have been Pelosi and China. It was probably due to LITTLE EVENTSlittle events in domestic politics, specifically a plagiarism scandal resulting in a DPP mayoral candidate withdrawing from the race.
So what did this poll find? Let’s start with President Tsai’s job satisfaction. In July, 56.2% were satisfied with her overall performance in office, while 41.0% were dissatisfied, yielding a net satisfaction of 15.2%. In August, satisfaction plunged to 50.4%, dissatisfaction skyrocketed to 46.5%, so net satisfaction plummeted to 3.9%!! What a disaster!! (Sorry, I got carried away there.) But seriously, this wasn’t a good result for the DPP. A 5% shift against you is pretty significant.
However, if we look at the August results against the last several years instead of just July, a somewhat more nuanced picture emerges. Over the past two years, Tsai has often had somewhere around a 55/40 satisfaction/dissatisfaction rating. However, there have now been three 5% shifts that produced a 50/45 balance, one after the May 2021 Covid outbreak, a second in the May 2022 Covid outbreak, and now this one. The softest supporters are the first to jump ship, and perhaps they just did it again. We will have to wait and see if they drift back in the next few months, as they did after the first two drops. At any rate, Tsai’s current satisfaction rating is at the bottom end of her previous range, but it is still within that established range. This isn’t a fundamentally new pattern. We certainly aren’t in the world of late 2018.
[update: Tsai’s approval rating bounced back a little in September, but it is a lot closer to August than July. Her net satisfaction is now at +5.9%. I didn’t expect it to bounce all the way back in one month, but I thought it might bounce back a little more than this.]
It’s the same basic story for party ID. The DPP didn’t do well in August (26.3%, down 2.3% from July). If you look at the past few years, the DPP has generally been somewhere between 25% and 33%, so this puts them at the lower end of that range. It’s not good news for them, but it also isn’t breaking any new ground.
Meanwhile, the KMT had a pretty good poll result. Between the summer of 2020 and the end of last year, the KMT usually got around 15%. However, they had several months of dismal results in the spring and summer getting 11-12%. In August, the KMT rebounded to 14.4%. That’s better than they had been doing recently, but well within the range of the previous two years. They’ll be very happy to have stopped their recent slide, but that’s about the extent of it. This is a good, not great, result for them.
[update: It’s actually not quite the same story for party ID. The DPP bounced back quite a lot in September. Their September support was actually a bit higher than in July. It’s interesting to see the difference in recoveries between Tsai and the DPP. The KMT fell a little, but their drop was fairly mild. The biggest story in party ID is over on the TPP side. The TPP got 10.4% in this poll. They had never even gotten 9% in a My Formosa poll before. The TPP has had a pretty good 18 months in party ID, so they might have high expectations for the upcoming elections.]
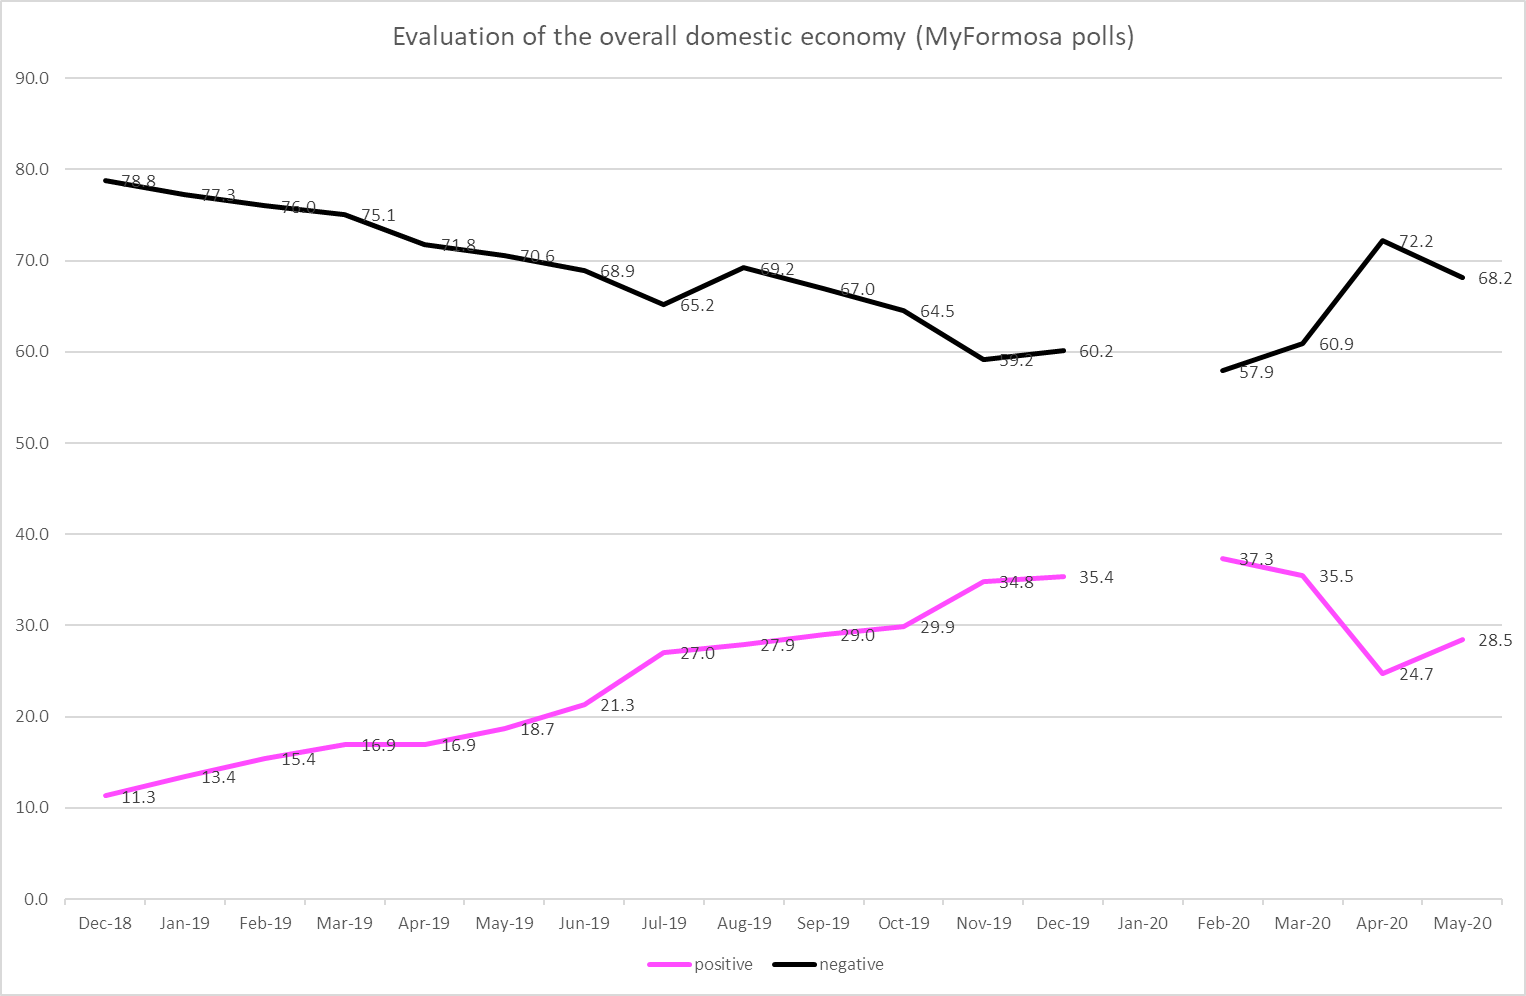
I could go through a few other standard questions from the My Formosa survey, but they are all basically the same story. The DPP had a bad month, falling near the bottom of its “normal” range. The KMT had a good month, recovering to the middle of its “normal” range.
So why do I think that this isn’t a reaction to Pelosi’s visit and Chinese military aggression? My normal inclination is to ignore the day-to-day minutia and pay attention to the big events. My basic assumption about Taiwanese politics is that an enormous proportion of things – maybe 80 or 90% – can be understood through the lens of national identity, attitudes toward China, party ID, sovereignty, and other questions that fit into the single dominant political cleavage. Everything else is fiddling around the edges. The last few things to really shake up the political system – the Sunflower movement and the Hong Kong protests/China’s suppression of political freedoms – were directly related to the dominant political cleavage. China making an aggressively threatening gesture like this could have mattered.
But it doesn’t look like that is driving these changes in the polls. My Formosa certainly doesn’t think it is the big thing that we all need to focus on. They didn’t even bother to ask any questions about Pelosi or the military drills.
There are two reasonably good quality surveys that focused on these questions. One was done by the Chinese Association of Public Opinion Research (CAPOR), an organization formed by blue-leaning academics who are primarily interested in China and international relations rather than public opinion. The CAPOR survey was done by Apollo Research, a pollster originally associated with the Want Want Group. (To be fair to Apollo, their polls are pretty professional, and I know several respected academics who trust them to produce data for their research.) The other poll was by the Taiwanese Public Opinion Foundation (TPOF), which is run by deep green (though not necessarily pro-Tsai) figures. I think it’s fair to say that, if these polls are biased, they should be skewed in opposite directions. In fact, they paint similar pictures.
TPOF asked if respondents welcomed Pelosi’s visit. 52.9% said they welcomed it, against 24.0% who said they did not welcome it. They then asked, “If we knew then that China would react by holding such a large-scale military exercise, should we have refused Pelosi’s visit?” Respondents rejected this suggestion by a 52.9% to 33.6% margin.
CAPOR asked if Pelosi’s visit had substantively helped Taiwan-USA relations. 53.7% said it had helped, while 27.4 said it had not helped. CAPOR then asked a few questions that looked to me like they were designed to attack the DPP. If so, they didn’t get the responses they were looking for. First, “Some people think, ‘Pelosi’s visit to Taiwan only benefitted the DPP; ordinary people didn’t feel anything at all.’ Do you agree or disagree?” 35.7% agreed, but 47.7% disagreed. Second, “Some people think, ‘If Taiwan still maintained the 1992 Consensus, Pelosi’s visit would not have caused such an extremely tense situation in the Taiwan Strait.’ Do you agree or disagree?” 36.1% agreed, and 41.3% disagreed.
The takeaway from both these polls is that there was no public backlash to Pelosi’s visit. On the contrary, it was popular, even though respondents could see China’s reaction. President Tsai and the DPP suffered in the polls following Pelosi’s visit, but it wasn’t because of Pelosi’s visit. Big events can have big consequences for public opinion, but that isn’t what happened this time.
Overall, Taiwan public opinion is still roughly the same as it was before the December referendums and perhaps even the January 2020 elections. Of course, these are local elections, and the individual candidates matter quite a lot. However, they are building their campaigns on fairly stable partisan turf. If the KMT candidates win easily in New Taipei and Taichung (as all signs indicate), it will be in spite of their party, not because of it.
It has been six months since I last posted anything on this blog. I apologize for my inactivity. It has been a difficult period in my personal life, and I just didn’t have the energy to work on this blog.
Lots of things have happened since January, so there has been plenty to write about. Covid has swept through Taiwan, Taiwan and the USA have started trade talks, Russia invaded Ukraine and the world has become more aware of Taiwan’s security challenges, KMT chair Eric Chu took a trip to the USA, there is no water crisis this year but now we are starting to worry about electricity, and on and on. The news never stops. However, if you step back and look at the wider picture, I’m not sure anything has fundamentally changed. President Tsai’s satisfaction ratings haven’t changed much, and neither has the relative popularity of the two major parties. The PRC’s ambitions for Taiwan probably haven’t changed that much, and neither has Taiwan’s willingness or ability to defend itself. The two parties have almost finished putting together their nominations for this year’s local elections, and none of the candidates are big surprises (with one glaring exception: the KMT in Taoyuan). The KMT is still in relatively good shape for this year’s elections, and they are still clueless about how to fight the 2024 national elections. VP William Lai still has the clearest path to the presidency. There are lots of new leaves and even a few new trees, but it’s still basically the same forest.
As always, I like to use the My Formosa polls as a standard reference. They ask the same questions over and over using the same methodology at regular intervals. They aren’t picking and choosing dramatic moments when someone will look better or worse, and they aren’t designing new questions each month to highlight someone’s successes or failures. This is a pretty good snapshot of how public opinion is evolving. There hasn’t been a lot of dramatic movement thus far during 2022.
President Tsai’s satisfaction ratings remain quite good. She’s had about 55% satisfied and 40% satisfied all year. There was a dip in May when the Covid outbreak seemed scariest, but her ratings rebounded in June. The Covid effect has turned out to be pretty small. About 20% of the population has been confirmed with Covid since January, but society has mostly shrugged it off. People haven’t been anywhere near as panicked as they were in the outbreak last summer. While last year’s outbreak was much smaller, it was scarier. The population was almost entirely unvaccinated, and about 1 of every 20 people who contracted the virus died. This year, nearly 90% of the population has gotten at least one shot, and only about 1 of every 500 cases has been fatal. Of those fatalities, nearly half have come from the small portion of the population that is still completely unvaccinated and a disproportionate number of the rest are from people who only got one shot. About 2/3 of the population has gotten three shots, and fatalities are quite low among that group. The public is no longer ecstatic about the government’s pandemic response, but it also isn’t particularly angry about it. Covid is still in the news, but it is usually the fifth or eighth most important news story of the day. There was a small but temporary effect in the May survey, but it doesn’t seem to have had a lasting effect. Covid is not going to be the dominant issue for the 2022 local elections unless there is a big change. In the meantime, President Tsai is still enjoying positive, stable job approval ratings.
If you want to look for some change in the data, perhaps there is something happening in party ID. It is possible that the KMT is losing popularity. The June poll was downright horrifying for the KMT. Only 9.5% expressed support for the KMT, barely more than the 8.9% for the TPP. We’ve seen plenty of lousy, sensationalist polls find that the TPP and KMT are even, but this is the first time I’ve seen them so close in a poll that I trust. This chart shows party ID aggregated into camps, and My Formosa always finds a few more people who said they support parties in a particular camp without naming which one, so the blue camp is noticeably higher than the TPP. Still, that is a dismal result for the KMT. Now, this is one poll, and the KMT’s party ID is quite different from previous months. It is possible that large numbers of previous KMT supporters were alienated by Chu’s trip to the USA or by nomination conflicts, but that seems a bit of a stretch to me. I’ll watch this number over the next few months, but I expect it to bounce back from the June data point. However, even ignoring the June number, if you squint your eyes a bit, you can see a slight downward trend in the blue camp’s popularity over the first half of 2022. It’s a small change (prior to June), but if I were a KMT strategist I’d feel a bit queasy looking at this overall trend.
Meanwhile, support for the DPP and green camp seems to be pretty stable. You might think that two years after the national election and six years into Tsai’s presidency, people would be getting tired of the status quo and itching for change. This is normally the time period in which the governing party is running out of steam and the energetic opposition party is gearing up to challenge for power. However, we don’t see much evidence of that this year. The DPP seems to be steadily maintaining its popularity, and the KMT isn’t showing many signs of rejuvenation.
As I have told several people this year, this might create an unusual context for local elections. In almost all of the recent election cycles, the government has been unpopular. This has meant that the opposition party has had a powerful appeal: send a message to the government and teach them a lesson! There was strong anti-government sentiment in 2018, 2014, 2005/6, and 1997. There was moderate anti-government sentiment in 2009/10 and 2001/2. I think the last time the government was actually popular might have been 1993/4. In 1993, I was a recent college graduate teaching English in a rural Nantou township and just starting to learn some of the basics of Taiwanese elections. That’s so long ago that the Central Election Commission website doesn’t even bother to report the 1993 results. Since many readers will not immediately think back to 1993/4, let me quickly recap. The DPP, which was still a fledgling party with no realistic hopes for taking power, made a big push in 1993 to exploit KMT factional rifts and win local power. It didn’t work. The KMT comfortably won most of the “contested” races. They even defeated the DPP incumbents in Changhua and Pingtung, the latter of whom was a charismatic bald guy who no one would ever hear of again. The next year, Taiwan held its first election for governor of Taiwan Province. The DPP had a fantastic nominee, the popular former Yilan County magistrate and widely respected Chen Ting-nan. The KMT could only put up a party hack with no electoral experience at all, a mainlander who didn’t speak any Taiwanese. All the energy was on the DPP side. Naturally, James Soong and the KMT won a decisive victory. At the same time, the KMT comfortably maintained its majority in the Provincial Assembly. The last time the government was popular in local elections, the opposition got swamped. I’m not predicting that the DPP will have a smashing victory in 2022. However, I do think it is worth remembering that the context might be different this time. We don’t really know what a popular government should expect from local elections in the current fully democratic regime.
At the beginning of this post, I said that the KMT seems to be in relatively good shape this year. It has a good roster of nominees. One of the effects of the 2018 KMT wave is that this year it has a lot of incumbents running for re-election. That is usually a big advantage. Hou Yu-ih in New Taipei and Lu Hsiu-yen in Taichung seem comfortably positioned to win their races. Those two are the traditional swing areas, so it’s a big deal if the KMT can safely put them in its column. The KMT should also be favored in Hsinchu County, Miaoli, Nantou, Hualien, Taitung, and, of course, Kinmen and Lienchiang. Even if they don’t win anything else, that’s a pretty solid result for a party that is showing such meager popularity in the national polls. And of course, they could certainly win a few other races. Taipei City might be hotly contested, but I’d still put my money on Wayne Chiang and the KMT to emerge victorious. And their incumbents give them a shot in greener-leaning areas such as Yilan, Changhua, Yunlin, Chiayi City, and Penghu. However, that latter group of races is where we might see the national partisan trends change some outcomes. Again, we don’t know how much it matters for local elections that people are mostly satisfied with the Tsai administration. But we can be fairly sure there won’t be a massive wave of voters angrily trying to send a message to the national government the way they did in 2018.
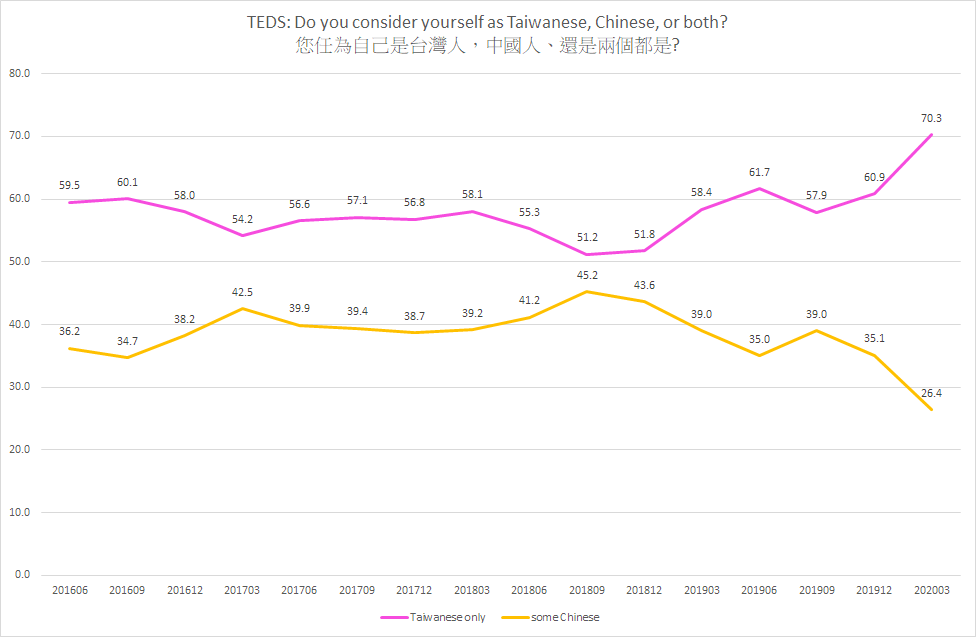
The Election Study Center at National Chengchi University has released an updated version of our big three political indicators today. Let me save you some time: there isn’t much dramatic change. The 2020 numbers for the green side were inflated a bit by the successful response to the pandemic, and now they have regressed a bit toward the mean and were dragged down by the lower numbers in the summer during the outbreak. Anyway, I’m not going to talk about the 2021 data points at all in this post.
The ESC has been tracking three indicators since the early 1990s: Party ID, Taiwanese/Chinese (T/C) identity, and preferences on unification or independence (UI). Every delegation of election observers, diplomats, media workers, or academics who has been to a briefing at the ESC has seen these, and these days they are widely cited in the popular media every time we update them.
There has been some discussion about the usefulness of polling data on preferences for Taiwan’s future status, with some people arguing it is fatally misleading. I believe the UI question continues to be useful.
Let me be clear about my biases. I hold a joint appointment at the ESC and have been associated with it in one role or another since 1995. I’m not a neutral observer; this is my family.
Here are the updated versions.
Of these three, I think UI is the least important. If you want to know what is happening today or tomorrow, look at party ID. If you want to understand the longer-term trends, look at the T/C identity. The party system and all national politics are ultimately grounded in identity. T/C identity is a simple question that asks respondents who they think they are. Respondents don’t need to worry about what anyone else is saying or doing, they just need to think about what they feel. Of course, what it means to be Chinese or Taiwanese is a shifting target in a world in which the PRC looms ever larger and demands the right to define terms for everyone. Nevertheless, this is a relatively easy and readily understandable question for most respondents.
In contrast, UI is a more complex question. It requires people to think about a lot of different questions, many of which are about unknowable things in the future. What does unification/independence mean? What would that world look like? What kind of life would I have in it? Is it realistic? Is it inevitable? What is the military capacity of the USA, PRC, ROC, and all the other countries that might be relevant? How willing are those countries to use their capacity?
In general, I’m not a big fan of questions that require people to imagine the future. Imagine, for example, that back in 2018 a prescient pollster had asked people, “If there were a global pandemic and scientists developed a vaccine, would you be willing to take it?” Would those results provide an accurate picture of what unfolded in 2021? Could our 2018 respondents even fathom what the pandemic would look like, much less the way various pundits would react to it? There are a bunch of people right now trying to ask whether Taiwanese citizens would fight back if the PRC invaded. Well, it depends. On what? Well, everything. The UI question isn’t quite this extreme, but the complex considerations make it less informative than party ID or T/C identity.
Nonetheless, the UI question remains useful for understanding how Taiwanese people understand the world today and their aspirations for the future. It doesn’t provide definitive answers, but it does provide some insights.
——————————————
First, let me establish that the status quo respondents are different in important ways from respondents who tell you they want independence or unification. Pundits on both sides are eager to claim that the SQ respondents really agree with their position. As pollsters, we are responsible for asking – not telling – respondents what they think. And it turns out that you can’t just put the SQ respondents on one side or the other. They are different from both. Here are some simple crosstabs from the 2020 TEDS post-election survey.
Ok, so respondents in the different groups think and behave differently. That isn’t the same as their UI preferences. TEDS probes a bit more deeply into the conditionality of UI attitudes, asking them to agree or disagree in four different scenarios, which I will label easy and hard independence and unification.[2]
Easy independence: If Taiwan could still maintain peaceful relations with the PRC after declaring independence, then Taiwan should establish a new, independent country.
Hard independence: Even if the PRC decides to attack Taiwan after Taiwan declares independence, Taiwan should still become a new country.
Easy unification: If the economic, social, and political conditions were about the same in both mainland China and Taiwan, then the two sides should unify.
Hard unification: Even if the gap between the economic, social, and political conditions in mainland China and Taiwan is quite large, the two sides should still unify.
(I have combined immediate and eventual unification (independence) into one category.)
Easy
independence
Hard
independence
Agree
disagree
agree
Disagree
Unification
42.6
50.7
20.4
74.1
SQ now, decide later
59.5
34.7
34.1
57.3
SQ forever
47.4
37.1
28.4
53.7
Independence
82.5
15.2
67.9
27.5
All
64.6
28.8
45.2
46.1
Easy
unification
Hard
unification
agree
disagree
Agree
Disagree
Unification
71.6
20.3
40.5
50.0
SQ now, decide later
34.7
58.5
10.4
82.0
SQ forever
19.3
62.9
8.3
73.1
Independence
13.0
84.3
3.7
93.1
All
26.0
66.3
10.0
81.7
I have no idea what to make of the 20.3% who say they want unification in our standard question, but they disagree with unification in the easy unification scenario. I don’t really understand the 20.4% who agree with hard independence either, though at least you can imagine some of them thinking a Chinese invasion would be the fastest way to bring about unification. Similarly, I don’t have an explanation for why 15.2% of people who want independence in the base question disagree with easy independence. These results are good reminders that every respondent has their own ideas, and they don’t always match up with the categories or logic that we think are reasonable. Every respondent is a unique soap opera.
The rest of the respondents make more sense (to me). Many readers will wonder about the SQ respondents, and these responses make it clear that they are not actually neutral between unification and independence. Clear pluralities are willing to have easy independence, but strong majorities are not willing to accept unification even in the easiest scenario.
The SQ forever respondents are particularly interesting. Just under half of them are willing to accept easy independence. The DPP insists that SQ forever is effectively independence, so we should just lump them together with the other independence supporters. This says otherwise. A good number of them seem to mean it when they say they want to maintain the SQ forever rather than seeking formal independence. You might argue that this is splitting hairs since the only difference is a formal declaration of independence, but that’s not nothing. Many of those people in the independence category actually want – some of them demand – a formal declaration. They had the opportunity to chose SQ forever and found it not good enough for them. They want independence, dammit! These two groups are not equivalent.
Why don’t we ask these four conditional questions in every survey? Why don’t we report these results to the media as breathlessly as the standard UI question? For one thing, it takes a lot of time to ask four questions, and we don’t ask them in every survey. More importantly, these are hypothetical conditions, and people differ quite a bit on how realistic or satisfactory these scenarios are. It’s hard to say that any of these questions provides a more definitive answer to what people want than the standard question in which we let them imagine the future for themselves.
——————————————-
Let me reiterate that, while the SQ respondents are qualitatively different from the independence respondents, they are NOT halfway between unification and independence. A very large number of them are openly hostile to the idea of unification. A decade ago, my colleagues (and fellow members of the ESC family) Hsiao Yi-ching 蕭怡靖 and Yu Ching-hsin 游清鑫 published a fantastic paper using data from 2009 in which they followed up on all those SQ answers. They first asked respondents what their second choice was, and if the respondents chose the other SQ option or refused to answer, they then asked which option the respondent could least accept. This produced a new six-category classification. What starts out as a two-to-one preference for independence (with only 30% expressing an opinion) ends up as a … two-to-one preference for independence (with 60% expressing an opinion) and a two-to-one preference against unification (with 90% expressing an opinion).
Base UI question
Hsiao and Yu Revised UI battery
Immediate unification
0.8
Immediate unification
0.8
Eventual unification
10.9
Eventual unification
18.7
SQ now, decide later
32.3
SQ, oppose independence
9.6
SQ forever
24.6
SQ, oppose unification
19.9
Eventual independence
17.5
Eventual independence
30.1
Immediate independence
3.9
Immediate independence
10.0
Non-response
3.9
Non-response
10.9
n
1130
N
1130
If you want to know more about what people think when they talk about unification or independence, there is no easy answer. They think about all sorts of different things. My colleague Cheng Su-feng 鄭夙芬 (who was the first person I met at the ESC and has been there since before we started asking any of these questions) has done a lot of focus groups over the past twenty years listening to people. She can tell you lots of stories about what people think they want. Unfortunately, the nature of this sort of qualitative research means that it is nearly impossible to summarize in one table or chart. It’s complicated; there is a person contradicting every clean narrative.
——————————————-
We are scholars, not pundits, and our primary reason for producing these data is to understand what has just happened rather than to try to predict the future or win a partisan argument. UI continues to be very useful for understanding a lot of things that we care about. As an example, let me present two very basic voting models in which I want to know who voted for the DPP candidate. The first is from the 1994 governor election, the first single-seat national election in Taiwan’s history. The second is from the just concluded 2020 presidential election. I’m just looking at T/C identity, UI preference, party ID, and ethnicity. I’m ignoring all the other standard variables (age, education, occupation, etc) because I’m lazy and this is a blog post, not a research paper. Still, look at the continuity over the past 26 years.
(A quick stats lesson: A positive coefficient (b) means respondents in that category were more likely to vote for the DPP candidate, and a negative coefficient means they were less likely. A zero coefficient means the variable doesn’t matter. If a coefficient is large relative to the standard error, it will be statistically significant. So powerful coefficients will be positive and significant (like Taiwanese identity) or negative and significant (like KMT party ID). These independent variables constructed from categorical variables and are compared to the missing reference category. So a person with a Taiwanese identity is significantly more likely to vote for the DPP candidate than a person with both Taiwanese and Chinese identities.)
The first conference I went to in Taiwan was in early 1995 when scholars were still figuring out how all these variables related to each other. I remember one professor (can’t remember who) saying that party ID, T/C identity, and UI preference were all “three sides of the same coin.” That is pithy and brilliant, though it overstates the correlation a bit. The three are all a bit different, so they all add a bit to the models. If, for example, I took out the party ID variables, the others would suddenly become much more powerful. The fact that they still matter even with party ID in the models illustrates their impact. The point here is that they do all matter. In fact, they arguably matter even more today than they did back when the modern party system was much younger. Since this post is about UI, let me point out that a respondent preferring either immediate or eventual independence votes differently than one who prefers one of the two SQ categories (SQ is the reference category in this model). Again, people who tell you they prefer the SQ cannot simply be lumped together with people who prefer independence or people who prefer unification. UI continues to be an important tool for understanding why things are happening the way they are.
——————————–
Questions like this that we ask again and again, year after year are extremely valuable for trying to figure out the impact of various events, telling convincing stories about what is happening, and simply identifying important trends. In recent years, the UI responses have been fairly stable and at the same time quite volatile. If we look at the results from the TEDS quarterly polls on presidential satisfaction since Tsai’s election, you can see a few peaks and valleys. For the first two years, it was pretty stable. 25% supported independence, 10% supported unification, and 60% supported the status quo. There was a sudden increase for unification in 2017, and in the three surveys from March to September 2018, unification was around 16% while independence was near 20%. Suddenly, the two were almost equal. Then 2019 reversed that trend and went even further in the opposite direction. By the early months of the pandemic, unification was down at 5% while independence soared to the high 30s. Since then, the numbers have regressed toward that original baseline, though they haven’t gone all the way back. Who changed?
I don’t have the time or energy to do a full breakdown of these shifts, so I’m just going to look briefly how at different age groups changed in four different surveys. I use June 2016 as a baseline; September 2018 was the peak of the unification wave; March 2020 saw the peak of the independence wave; and September 2021 is the most recent survey that we have data for.
It is fairly well-known that younger people have stronger support for independence. In fact, there is a fairly sharp dividing line at around 40 years old. People under 40 look pretty similar and people over 40 look fairly similar, but those two groups are notably different from each other. This is even clearer in T/C identity, but you can see it in UI as well.
One clear age divide involves support for the status quo. Younger people are not nearly as interested in SQ as old people, and this is especially true for SQ forever. Perhaps “forever” means something different to people who are 25 and 75. However, young people are also not that interested in deciding later, even though they have plenty of time left to make that decision.
What happened with that that spike for unification in Sept 2018? It occurs in all age groups, though it is a bit smaller in the 20-29 group. It wasn’t just gullible old people or naïve youngsters; all ages were susceptible to whatever suddenly made China look more appealing. Where did all those new unification supporters come from? The over 50 groups saw huge drops in support for SQ forever. The under 40s actually saw slight increases for the two SQ categories, but they saw huge drops in support for independence. Now, young people are generally less entrenched in their beliefs and more open to new ideas, but I don’t think all those youths went straight from independence all the way across the political spectrum to unification. I think it is more likely that many young independence supporters shifted to SQ, while many SQ supporters shifted to unification. At any rate, there were different patterns among young and old respondents.
What about the surge for independence in March 2020? It was much larger among younger voters. However, those big gains for the younger voters have mostly faded. Support for independence for people in their 20s and 30s is not that much different in September 2021 from its level in the June 2016 baseline survey. March 2020 was a temporary surge for them. It looks as if they tried out some new ideas but eventually ended up back where they started. Older voters had a much smaller surge in March 2020, but those changes have persisted. I assume that it is harder to change an older voter’s mind, so it is quite dramatic to see support for independence among people in their 40s, for example, go from 16.7% in June 2016 to 28.6% in September 2021. Most media coverage about the effect of Hong Kong has focused on young people and their sense of “dried mangos” (existential national crisis), but the more powerful impact might be on older voters who were thoroughly disillusioned by China’s actions.
——————————————
One of the interesting rabbit holes I dug into while thinking about this topic was the early days of UI questions. We didn’t get it right the first time. This was back when we were still figuring out lots of things about how to do polls, and we didn’t yet have a lot of standardized questions that we asked in exactly the same form year after year. The first time I can find a UI question is 1991. (We might have asked it in 1989, but I don’t have the 1989 data on my hard drive.)
We didn’t do a national face-to-face survey after the 1991 National Assembly elections, but we did do a national post-election telephone survey. The question asked was:
有人主張要台灣獨立,有人主張要中國統一,也有人認為最好維持現狀,請問您的意見是什麼?
Some people support Taiwan independence, some people support Chinese unification, there are also people who believe it is best to maintain the status quo. What is your opinion?
1991 ESC national telephone survey
%
Taiwan independence
2.6
Chinese unification
18.3
Maintain status quo
62.4
Don’t care
4.3
Don’t know
10.2
Other non-response
11.2
This is a comically disastrous polling result. More people gave a non-response than expressed a preference for unification and independence combined. These answers tell you almost nothing interesting about what people wanted. You certainly can’t use this in vote decision model.
UI wasn’t a trivial question in 1991. The DPP had treated the 1991 National Assembly election as a test case for its independence plank. The entire campaign was centered on its call for independence. The KMT, sensing the unpopularity of the DPP’s position didn’t shy away from this question. In the end, it was a catastrophic result for the DPP, which only managed to get 23.5% of the votes. The KMT won 254 of 325 seats, more than the 75% threshold needed to allow it to unilaterally amend the constitution.
Still, independence must have had more than 2.6% support in the electorate. Remember that Taiwan was still only a few years removed from martial law. People were still hesitant to answer questions openly and honestly, especially when their opinions ran counter to the KMT’s positions. This continued to be a problem until about 1995. So the challenge for the ESC in the early 1990s was to rephrase this question in a way that coaxed hesitant respondents to reveal useful information about themselves while still remaining neutral.
The 1992 post-election survey tried adding a fourth category. It asked the question:
In last year’s legislative election, some people supported Taiwan independence, some people support Chinese unification, some people supported One China One Taiwan, and there were also people who supported maintaining the status quo. What is your opinion?
1992 ESC national post-election survey
%
Taiwan independence
3.6
Chinese unification
17.1
Maintain status quo
52.9
One China, One Taiwan
3.4
Don’t care
2.2
It depends
4.1
No opinion
5.8
Don’t know
9.8
Refuse to answer
1.1
That’s a little better, but not much. You still have 23.0% of people giving non-responses, and more than twice as many people placing themselves in the neutral SQ category as in one of the more interesting positions. You just can’t do much interesting analysis if most people either put themselves in a neutral category or refuse to answer the question.
The ESC scholars revamped the UI question for the 1993 post-election survey, producing what is more or less the modern form.
關於台灣和大陸的關係,有幾種不同的看法,請問您比較偏向那一種?
Concerning the relationship between Taiwan and the Mainland, there are several different opinions. Which one do you lean toward?
[Respondents were shown a card listing the six different options.]
1993 ESC national post-election survey
%
Unification as soon as possible 儘快統一
4.3
Maintain status quo, later move toward unification 維持現狀,以後走向統一
23.2
Maintain status quo, judge the situation, then decide independence or unification 維持現狀,看情形再決定獨立或統一
32.4
Maintain the status quo forever 永遠維持現狀
23.1
Maintain status quo, later move toward independence 維持現狀,以後走向獨立
7.6
Independence as soon as possible 儘快獨立
2.8
Difficult to say
2.1
No opinion
3.8
Don’t know
10.7
Refuse to answer
1.7
This was a major improvement over previous versions. First, the percentage of non-responses was reduced significantly, dropping from 23.0% to 18.3%. Second, the enormous status quo category was cut into two smaller categories. Third and most importantly, more people were coaxed out to express a preference for independence and unification, which is what we really cared about. 17.1% expressed a preference for unification in 1992, while the 1993 wording produced 27.5% support for unification. Similarly, the 1992 survey found 3.6% for independence, while the 1993 survey found 10.4% supporting independence. To the naked eye, it looks as if respondents in the earlier surveys heard “independence” as equivalent to “immediate independence,” and the addition of a less threatening “eventual” independence category coaxed some reticent respondents to reveal a preference.
As for those two SQ categories, it wasn’t simply a matter of cutting a big category into two smaller pieces. Unlike the 2020 data I presented above, those two SQ categories were a bit different in 1993. The SQ forever respondents were a bit more likely to have a Taiwanese identity and a bit less likely to have a dual identity. On exclusively Chinese identity, the two SQ categories were clearly in the middle. Still, these two SQ categories had some subtle differences from each other. This was something scholars could chew on. (Eventually, we collectively decided it wasn’t worth the effort to focus too much on this difference, since other differences were much more powerful. Also, the distinction has faded over time. We didn’t know that in 1994, though.)
1993 ESC post-election
T/C identity
Taiwanese
both
Chinese
Immediate unification
30.0
35.0
31.7
Eventual unification
15.2
47.8
34.8
SQ now, decide later
31.2
46.2
19.9
SQ forever
39.7
35.9
21.8
Eventual independence
36.8
47.2
13.2
Immediate independence
72.5
25.0
2.5
It was somewhere around this time that the ESC made a commitment to track the three big indicators. Since the mid-1990s, we have asked these three questions in every survey we do. It doesn’t matter what the topic is. We might be commissioned to do a survey on health care or gender equality, but we will insist of having these three questions. We are more likely to agree to drop a demographic question than one of these three. To give you an idea of what an enormous investment this is, remember that you can only ask about 30-35 substantive questions in a telephone survey. These three questions are a 10% tax on the available time and space. Those three charts I showed at the beginning of this post don’t represent one survey each year. Each year combines all the surveys we did in that calendar year; each data point represents tens of thousands of respondents. We firmly believe that these are critical to understanding political events in Taiwan.
I have one more point to make. This is more about politics than polling. The DPP went through a monumental shift in the 1990s. In 1990, they adopted the Taiwan independence plank in their party platform, making the pursuit of Taiwan independence a central goal of the party. They were not referring to maintaining the status quo or just maintaining a de facto separation from China. They wanted a formal declaration of independence, a new constitution, and a change of the country’s name from Republic of China to Republic of Taiwan. They did not consider Taiwan to already be independent; independence was something that had to be pursued. As I noted, this was the core appeal in their disastrous 1991 National Assembly campaign. The 1991 election was the first national election with all seats elected, and no one quite knew what to expect. The independence activists were confident that the voters had been waiting for an opportunity to support independence. It turns out they badly misjudged the electorate. The DPP toned down their demands for formal independence in the 1992 legislative elections and did much better. The rest of the 1990s were a gradual process of distancing themselves from the Taiwan Independence Plank. In 1995, Shih Ming-teh 施明德, who was widely understood as a Taiwan independence radical, was elected DPP party chair. Upon taking office, Shih made the momentous declaration that the DPP could not and would not 不能也不會 declare independence if it came to power. As the 2000 presidential election approached and it seemed plausible that the DPP might be competitive or even win, Chen Shui-bian pushed the party to pass the Resolution on Taiwan’s Future 台灣前途決議文, which downgraded the Taiwan Independence Plank to a mere historical document. At some point, the DPP started claiming that the status quo was already independence, and the large group of people who supported maintaining the status quo forever should actually be understood as Taiwan independence supporters. The KMT spent most of the 1990s and 2000s ignoring this shift and gleefully trying to tie the DPP to formal Taiwan independence. For the first two decades of democracy, the conventional wisdom was that formal independence was ballot box poison 票方毒藥。In the Tsai era, we hear almost nothing about formal independence. The status quo is widely understood as de facto independence, and unification would require a dramatic change to the status quo. Unification is now the radical idea that is ballot box poison. It’s amazing what a dramatic shift this has been.
I don’t have any evidence for this, but I wonder if the ESC surveys played some role in this transformation. Elections showed that formal independence was not as popular as activists had thought, and the new surveys backed this up. Meanwhile, the new surveys showed that there was an enormous group in the middle of the electorate that could easily be redefined being for de facto independence. It’s never easy to abandon a cherished position, and formal independence was a cherished position. However, the new surveys might have been a slap in the face telling the DPP elites and activists why they were losing and how to stop losing. It’s possible that the “SQ forever” category has been a catalyst for the modern independence movement.
[1] Tsai didn’t actually get more than twice as many votes as Han. Post-election surveys often find too much support for the winner and not enough for the loser. And turnout wasn’t 88% either. Post-election polls aren’t perfect, and the government won’t let us do exit polls. This is the best we have.
[2] A fair number of respondents will react to these hypothetical conditions by protesting that they are impossible and refusing to answer. Not everyone imagines the same possibilities for the future.
My-Formosa 美麗島電子報 has released its November poll. This is the first high quality poll to be released since the referendum campaigns began in earnest about a month ago. Earlier polls showed that all four items were favored to pass, but the DPP has been waging an energetic campaign to vote “no” on all four. This poll is the first solid evidence we have of the effectiveness of that campaign.
Before looking at the referendums, let’s first look at the general lay of the land. From a partisan perspective, this month’s poll is similar to or even slightly better for President Tsai and the DPP than the previous few months. Tsai’s favorability rating is currently +14.0% (55.8% satisfied, 41.8% dissatisfied). On party ID, 40.4% support a green party, 19.0% support a blue party, and 7.0% support the TPP. If you consider the TPP to actually be in the blue camp (and that increasingly seems to be a reasonable assumption), the numbers look a lot like those right around the January 2020 election. As you’ll recall, Tsai won that election by 19%. As far as I can tell, the electorate hasn’t changed very much since then. So that’s the underlying partisan structure.
With that out of the way, let’s get to the referendums. Here are the bottom-line numbers.
All respondents
yes
no
Yes – no
R17: Restart 4NPP
37.8
51.9
-14.1
R18: Ban ractopamine pork
55.4
37.9
+17.5
R19: Referendums on same day
46.1
41.7
+4.4
R20: Move LNG / protect coral reef
35.0
41.1
-6.1
The two energy referendums (R17 and R20) are now showing more opposition than support, and this is particularly evident for R17. This probably has something to do with the KMT withdrawing its all-out support for these two items a month ago. The two items that the KMT explicitly sponsored are still in positive territory. The gap in R19 is positive, though it is smaller than it was in much earlier polls. The gap in R18, the pork referendum, is still a gaping 17.5%. At first glance, the DPP doesn’t seem to have made any headway there at all.
But wait. That might not be the entire story. We don’t know what turnout will be, but it certainly won’t be 100%. Only 62% of respondents said they would definitely turn out to vote. For reference, a month before the Jan 2020 election, 77% said they would definitely turn out. I’m skeptical we will get 62%, but mid- or high 50s seems plausible. At any rate, those 62% are a bit different from the 38% who aren’t so sure about voting.
Will Definitely Vote (62%)
yes
no
Yes – no
R17: Restart 4NPP
39.1
54.9
-15.8
R18: Ban ractopamine pork
51.0
44.6
+6.4
R19: Referendums on same day
47.2
46.5
+0.7
R20: Move LNG / protect coral reef
37.9
46.6
-8.7
The two energy referendums are basically the same, but the two KMT referendums are much closer. R19 is now basically tied. R18 is still passing, but more than half of the margin has evaporated. If this is the right way to look at the polls, R18 is within shouting distance.
Let’s unpack these results a bit. One of the great things about the My-Formosa polls is that they give us lots of cross-tables, so that we can look at the results in a bit more detail.
Why does turnout matter so much? Green voters are more motivated to vote, and they are the biggest section of the electorate.[1] In the full sample, green voters make up 40% of the sample. When you adjust for turnout, they make up nearly half the voters.
Party ID
Will definitely vote
respondents
Group size
Adjusted group size
Blue
67.4
205
19.0
20.6
Green
73.6
435
40.4
47.8
TPP
67.2
75
7.0
7.5
neutral
46.3
328
30.5
22.7
Ok, but are those green voters a disciplined, monolithic voting bloc? Actually, no. And neither are the blue voters. As for TPP supporters, they are pretty close to the KMT in every category. This isn’t just a matter of referendums; their answers to more partisan questions such as satisfaction with President Tsai also look a lot like those from blue supporters. There really isn’t much point in discussing them separately; mentally you can just lump them in with the blue voters.
R17 has the clearest partisan lines of the four items. Since Taiwanese have been fighting over the 4th Nuclear Power Plant for three decades and the fights were sharply defined along partisan lines early in Chen Shui-bian’s presidency, maybe this isn’t surprising. However, even here the two big camps aren’t monolithic. This is a more difficult topic for blue voters, and only 70% of them support this referendum.
R17: 4NPP
yes
no
other
Group size
Blue
69.3
21.8
8.9
19.0
TPP
60.6
36.2
3.2
7.0
Green
14.8
80.8
4.4
40.4
neutral
44.1
36.8
19.1
30.5
All respondents
37.8
51.9
10.3
100.0
The pork referendum is the mirror image of 4NPP. Here, the blue side is overwhelmingly in favor, and the green side is a little divided. One-fourth of green voters plan to vote against the DPP’s position. Given that they are trailing and still need to change some minds, this isn’t necessarily bad news for the DPP. The existence of a pool of voters who generally like and trust Tsai for the DPP to work on is a good thing. It should be a lot easier to appeal to those voters than to other groups. If they can persuade DPP sympathizers to turn out and vote for the DPP position, victory is not impossible. It is also stunning how lopsided the neutral voters are. These will be harder for Tsai and the DPP to persuade since they don’t necessarily trust the messengers. A higher turnout of this group would probably guarantee passage of the referendum.
R18: pork
yes
no
other
Group size
Blue
85.8
12.7
1.5
19.0
TPP
78.2
20.4
1.4
7.0
Green
26.6
69.2
4.2
40.4
neutral
67.3
19.3
13.4
30.5
All respondents
55.1
37.9
7.0
100.0
R19 has even more muddled partisan lines. For the blue camp, this probably reflects longstanding skepticism toward referendums and the memory of the chaotic 2018 elections. For the green camp, it is probably due to decades of arguing for the establishment of referendums and then for more permissive rules.
R19: same day
yes
no
other
Group size
Blue
65.8
26.1
8.1
19.0
TPP
64.3
33.1
2.6
7.0
Green
32.3
58.5
9.2
40.4
neutral
47.0
32.7
20.3
30.5
All respondents
46.1
41.7
12.2
100.0
R20 is the most opaque. Both camps are internally divided. More than that, voters seem to be more unsure about this referendum than the others. Nearly one-fourth of respondents did not express a preference on R20. This is a technically difficult question, and, unlike the others, voters haven’t been discussing this topic for years and years. There will be a lot of voters who turn out to vote for the other three items and then, by the way, also cast an unsure vote on R20, and those voters could well decide whether this referendum passes or fails.
R20: LNT / coral reef
yes
no
other
Group size
Blue
54.7
26.5
18.8
19.0
TPP
63.5
27.6
8.9
7.0
Green
19.6
64.5
15.9
40.4
neutral
36.9
23.2
39.9
30.5
All respondents
35.0
41.1
23.9
100.0
I had expected that support for the two energy-related items would look similar, but I was dead wrong. This table shows the percentage of the electorate in each box (so if you add them horizontally or vertically you will get the subtotal). I expected people to vote yes on both or no on both, but the poll shows a much more complex picture. About 10% of all respondents chose yes-no, and about the same number chose no-yes. And there are a lot more who are still unsure. Clearly, large parts of the electorate do not think of these two measures as being closely related.
R20
LNG, reef
yes
no
other
all
Yes
21.2
9.0
7.6
37.8
R17
No
12.1
31.4
8.4
51.9
4NPP
Other
1.8
0.7
7.9
10.4
All
35.0
41.1
23.9
100.0
Finally, let’s look at some demographic differences. There aren’t a lot of dramatic patterns, and many of the differences can be explained by partisanship.
On gender, it is useful to remember that men generally support the DPP a bit more than women. For example, President Tsai’s satisfaction rating is 5.6% lower among women than men.
On three of the four items, there is not much of a gender gap. For example, women are against R17 by a 14.5% margin while men are against it by a 13.5% margin. That’s not much of a difference. However, there is a gaping gender gap on the pork referendum, where women support it by 28.1% but men only support it by 6.6%. If R18 passes, it will be driven by women.
The other thing to note is how many more women are unsure. On R20, 84.1% of men expressed a preference while only 68.8% of women did. If you stare at the numbers long enough, you can almost hear the mansplaining.
R17
4NPP
R18
pork
R19
same day
R20
LNG, reef
yes
no
yes
no
yes
no
yes
no
Women
34.7
49.2
59.6
31.5
44.8
39.3
32.2
36.2
Men
41.1
54.6
51.1
44.5
47.4
44.1
38.0
46.1
Gender gap
-1.0
21.5
2.2
4.1
There aren’t a lot of geographic differences, and most of those are probably related to partisanship. However, I will note that support for R20 is highest in Taoyuan-Hsinchu-Miaoli (+9.6% locally; -6.1% nationally). Cynically, I suspect that they are more interested in blocking construction of a local power plant than saving their local coral reef.
I’m also not seeing a lot of dramatic patterns in age and education. Perhaps the most interesting deals with education and R20. Recall that R20 was the most confusing item. There isn’t a lot of difference in the “no” vote, but there are enormous differences in “yes.” I’m not sure how to interpret this, but it is striking. R17 and R19 show similar patterns, but they are not quite as extreme. R18, the pork referendum, is the outlier. In that one, there is a U-shaped pattern, with support for R18 lowest in the primary or less group, highest in the high school group, and just about at the national average in the university and up group.
R20
LNG, reef
Size of group
yes
no
Primary or less
11.8
42.5
12.0%
Junior high
28.3
46.3
11.8%
High school
34.4
38.9
27.6%
Technical college
46.6
34.8
11.6%
University and up
41.4
42.6
36.9%
Many of these patterns are probably insignificant or even ephemeral. There are only two that I’m fairly confident about. There are clear partisan patterns, and there is a clear gender gap on the pork referendum.
Right now, the pork referendum is the most likely to pass, and the 4NPP referendum is most likely to fail. However, there are clear indications in this data of how the DPP might defeat the pork referendum, which is after all far and away the most important of these. In a nutshell, they need to convince their supporters to support them. If they can persuade voters who already prefer to the DPP to vote overwhelmingly against the pork referendum, they have a realistic path to victory. It’s a heavy lift, but there is a path.
[1] There isn’t much to learn about the New Power Party (1.1% support), Taiwan Statebuilding Party (2.2%), or People First Party (0.2%) from this poll. They just don’t have enough support to fruitfully analyze. The overwhelming majority of the blue (green) voters support the KMT (DPP). Both camps also have about 5% who don’t mention any specific party but place themselves in that camp. Generally speaking, all the trends are a bit sharper if you look specifically at KMT and DPP support, but I prefer simplifying things into four big groups. I’m also ignoring the 3.1% of the sample that didn’t give a valid response to the party ID question since they are very small and the least likely to turn out.
It looks to me like this outbreak of Covid in Taiwan is almost finished, so we now have a full cycle of events under our belt. First, there was the news of the outbreak, then we watched in horror as cases spiked and the government scrambled to figure out how to react, then the cases started to fall, and now we are back to having almost no domestic transmissions. So how did all of this affect public opinion?
Let’s do a quick recap of the virus outbreak. I’m going to use several charts from the Our World in Data website run by Oxford which uses data collected by Johns Hopkins.
Up through April, the well-established narrative was that Taiwan had almost miraculously managed to stay Covid free while the rest of the world struggled with the virus. Of course, it wasn’t a miracle. It was a combination of circumstances, luck, public enthusiasm for masks, and, most of all, good public policy. Put simply, Taiwan’s performance was the best in the world. That all exploded in early May. We didn’t know it at the time, but Mother’s Day was probably a disaster. There was already enough virus floating around, and families – young and old – got together in big groups. During the second half of May, case numbers skyrocketed. Every day the news seemed to be worse, and we all watched, shellshocked. The same government that had seemed so confidently in control for over a year suddenly looked like it was no longer on top of things. For a year, lockdowns, shopping restrictions, and remote school and work were things they had to do in the rest of the world. Suddenly, the pandemic had come to Taiwan. We didn’t have a hard lockdown, but people were strongly encouraged not to go out and to work remotely if possible. Schools went virtual for the last two months of the school year. Restaurants were not allowed to have indoor dining. We had blackouts because suddenly people were running their home air conditioners during the hot summer days. And all at once, the entire population seemed to realize that almost no one had been vaccinated. It hadn’t seemed urgent in April, but by late May everyone wanted to get vaccinated NOW.
The chart shows that cases peaked right around June 1 and fell sharply all throughout June. Let’s just say that no one thought things were all rosy in June. Maybe things weren’t getting worse every day, but we were still solidly in the middle of the pandemic. By early July, the curve shows that Taiwan was under 100 cases a day, and it was roughly 20 cases a day in the second half of July. We finally started moving from a Level 3 emergency to a Level 2 emergency in late July, which I think is when most people started to feel that we were going to be ok. August has solidified that feeling. Hospitals are relaxing a bit and are more crowded. Restaurants are cautiously resuming indoor dining. Schools are started the new year with in-class instruction. There are still cases, but most days in August domestic transmissions were only in the single digits. In fact, there are more cases arriving at the airport (and identified during quarantine) than there are domestic transmissions. Things are still not exactly normal. Masks are ubiquitous. Baseball games are not crowded. People are hesitant to eat out or congregate. But it is much more normal now than it was two months ago. There is still a person at the door of most supermarkets making sure you register, but they are a lot more relaxed now.
The other thing that has changed is the rest of the world. In May and June, most of the world was feeling good. Cases had spiked in the winter but had fallen tremendously during the spring, so lots of countries were going “back to normal” right as Taiwan was entering the pandemic. Now, it is almost exactly the opposite. The delta variant has caused spikes around the world, and suddenly Taiwan is once again one of the safest places to be.
If you look at the standout performers, back in June Taiwan was much worse than New Zealand, Australia, or Singapore. You could often hear blue pundits screaming that Taiwan’s government was terrible and needed to be more like Singapore’s. At the end of August, it doesn’t look like that any longer. Those countries – even New Zealand – are all dealing with outbreaks, while Taiwan seems to have things under control. The TV pundits aren’t screaming that we need to follow the Singapore model these days.
If you look at our regional neighbors, Taiwan looks even better. South Korea and Vietnam were better than Taiwan back in May and June, and Japan was pretty close. South Korea has edged upward, while the other countries have gotten much worse. When you look at the data using this scale, Taiwan’s peak doesn’t even look very bad.
Of course, the country that Taiwanese most often use as a reference point is the USA, so let’s look at it and a few other rich democracies. The USA and UK are currently in the midst of terrible outbreaks. Germany and Canada would fit comfortably on the previous chart with Japan, but for the USA and UK we need to make the Y-axis three times higher. On this chart, you can barely even see Taiwan’s “surge.” It is true that all these countries have been, at one time or another, in the ballpark of Taiwan’s peak. However, right now they are all much, much worse.
Let’s be honest about how much this means. Even in relatively outward-looking Taiwan, most people judge the government by how things are going here, not by how things are going in other places. Still, it does seep into how people talk about local politics. Back in June, a friend asked me if I was going to go to the USA to get a Pfizer vaccine shot. In her mind, the USA was safe, and everyone was getting the good vaccines. She was flabbergasted when I responded that cases were twice as high in the USA as in Taiwan and that Taiwan would soon be more vaccinated than the USA. People here still routinely overestimate how well the USA is responding to the pandemic, but it isn’t a constant talking point as much right now. All in all, we are not back to the time when people proudly talked about how Taiwan was doing better than everyone else, and the rest of the world should learn from Taiwan. However, we are also not hearing that things here are a total disaster, and we should try to be more like other countries.
What has this meant for public opinion? I think it is safe to say that the pandemic has been far and away the biggest news story over the past four months. If there are changes in public opinion, it is fair to assume that they are driven by the pandemic.
I did not write about public opinion back in May and June for a couple of reasons. First, I was busy with other stuff. Second, I wasn’t sure about the polling. You don’t need to know about my personal life, but let me comment briefly on polling.
Good polls in Taiwan are still done by telephone. In many places, such as the UK and USA, internet polling is nearly as good or perhaps even better than telephone polling. This is both because their internet polls are better than Taiwan’s, and, more importantly, because their telephone polls are much, much worse. In the USA, if you call 100 numbers, you will successfully interview fewer than five people – maybe fewer than one. In Taiwan, we can usually complete over 20 interviews from those 100 calls. You can get a representative sample in Taiwan; it’s a struggle in the USA.
How do you complete 1000 interviews in two or three evenings? Taiwanese pollsters do not allow their interviewer to work from home. You have one big room with about 50 computers hooked up to phones. The random number is automatically put into the system, and the survey software is all right there. Having everything all in one place also aids quality control. You can listen in on interviews to make interviewers are asking questions correctly, and you can step in immediately if there are any problems. This all works well; it is a reliable and well-tested system.
In the age of Covid, there are problems. Putting 50 interviewers and 10 staff in a room is efficient but not particularly safe. You can spread people out, but that means only using one half or one third of your available lines. Instead of finishing in two or three days, a survey might take a week or ten days. Also, interviewers aren’t eager to show up for work. This is not a highly paid job, and it is usually paid by the hour. If it seems unsafe, it might be best to just opt out for a few weeks or months. And the official Covid regulations seemed to prohibit putting large numbers of people in a single room. At the Election Study Center, we simply stopped doing telephone polls in May and June.
The private pollsters, however, did not stop, and I wondered how they managed to produce their polls. As far as I have been able to understand, they simply did not observe the government guidelines as strictly as we did. As a public institution, we had to follow the rules very carefully. (Also, if the entire university had to close down because of a case involving an ESC interviewer, there would have been hell to pay.) Private pollsters had a bit more leeway. Apparently the restrictions on public gatherings had a loophole (something to the effect of “…unless it would cause significant financial damage”), and they just decided to go ahead until a government agency told them to stop.
There is also a question about the respondents. In the USA, many people suspect that the presidential polls were skewed by the lockdowns. People who stayed home were more likely Democrats, so there were too many Democrats answering the phones. We don’t know if anything like that happened here.
Anyway, back in May and June when the first post-pandemic polls came out, I was skeptical enough about their quality that I didn’t want to pay too much attention to them. Looking back at them now with a bit more knowledge of how they were produced and with a bit more data to compare them to, I guess I think they are … fine. They’ll do. There don’t seem to be any glaring red flags. There probably aren’t any pollsters who think these are the best polls they’ve ever produced, but they are probably good enough to give a general impression of what happened over the summer.
My favorite public polls are from my-formosa.com. Tai Li-an produces a monthly poll in which he asks the same questions every time, giving us a very nice time series and plenty of context.
I think everyone expects to see the pandemic causing a substantial drop in popularity for the government in May and a rebound in August. The main question is how much?
The best place to start is with President Tsai’s job satisfaction. During the first half of 2020, she had sky-high satisfaction ratings – in the high 60s. She had just won re-election, and Taiwan’s ability to keep the virus out won plaudits from all sides. This could not last, and it didn’t. In the second half of 2020, normal politics reemerged. Instead of talking about the pandemic all day every day, the focus turned to more mundane issues such as American pork imports, Chinese military threats, air quality, the train crash, water supply, and so on. As regular partisan attitudes pushed out the extraordinary pandemic response attitudes, Tsai’s approval ratings slipped a bit. From late 2020 into spring 2021, she was generally somewhere in the high 50s. This was still high, but no longer stratospheric. In March, she was at 59.3%, and in May she was at 56.0%. So let’s think of high 50s – maybe 57-58% – as the pre-pandemic baseline. May, June, and July are clearly different. For those three months, she as just below 50%, ranging from 47.6% to 49.6%. That’s about a 10% drop. To look at it another way, before the pandemic her approval ratings were about 20% above water. After it, approval and disapproval were roughly even.
I was surprised by the 10% drop. I expected it to be bigger. I had assumed that her previous high approval ratings were based heavily on the successful pandemic response, so this would take a heavy toll. 10% is not small, but after what the public seemed to think was a major governance failure, I expected more. I seemed surprising to me that, in the midst of this crisis, just as many people were satisfied with her performance as were dissatisfied. I can think of a few reasons I was wrong. First, it could be that people responded to the crisis by rallying behind the current government. We have seen this happen in several countries over the past two years. Second, another possibility is that people did not see the outbreak as quite as much of a governing failure as the media led us to believe. Third, perhaps people were impressed by the government’s crisis response. Fourth, it might be that Tsai’s satisfaction ratings were not as dependent on pandemic response as I had thought. At any rate, Tsai’s popularity took a noticeable hit, but it was not a catastrophic blow. Presidents around the world can and have governed effectively with net negative satisfaction ratings. A net zero rating is politically quite tenable.
However, Tsai does not have to navigate around her net zero satisfaction rating. In August, Tsai’s popularity has recovered most of those losses. It is now 55.0%, which is only a bit lower than her pre-outbreak numbers. Her dissatisfaction is a bit higher than it was in the spring, so instead of being almost 20% above water, she is only 12% above water. Still, this is a clear rebound from three months of relatively bad results.
We can see the same pattern in feelings toward the DPP. For most of the past year, good feelings toward the DPP have outweighed bad feelings. However, the was not the case in May, June, and July, when more people expressed negative feelings toward the DPP. In August, the DPP recovered most, though not all, of those losses.
Well, we’ve seen a pretty clear pattern. May, June, and July were terrible for the DPP, and then it recovered. Since there are two big parties, we’ll see the exact opposite for the KMT, right? No!! The outbreak hurt the DPP, but it did not help the KMT.
Looking at feelings toward the KMT, in the several months before the outbreak, about 34% expressed positive feelings toward the KMT. This fell to the high 20s in June and July. The KMT was LESS popular during the outbreak. It’s almost as if the public didn’t appreciate their willingness to jump on any opportunity to score cheap political points.
You can see the KMT’s failure to capitalize on this opportunity in the party ID figures. We see support for the DPP taking the expected dip in May, June, and July. But during those months, the KMT’s support was also going down. When you aggregate all the parties into their respective camps, you can see that the blue camp had generally been doing better in late 2020 and early 2021 than in early 2020. That is, when Tsai’s satisfaction fell as regular politics reemerged, the KMT also regained some of its support. That is the normal pattern of things. However, that didn’t happen during this outbreak. Even in August when the blue camp’s overall support recovered a bit, it wasn’t the KMT that was benefitting. Rather, there was a big increase in “other blue.” If I understand the answer categories correctly, this is not a reference to a specific blue camp party such as the New Party or the MKT. Rather, respondents are given the option of saying simply that they support the blue camp without specifically choosing a blue camp party. To put it another way, these respondents haven’t fundamentally changed sides, but they also aren’t crazy about the KMT these days. They are looking for alternatives.
One of those alternatives might be the TPP. Before the outbreak, the TPP was at 4-5%. After the outbreak, it has been around 7%. Most people think of the TPP as a not-green, not-blue party, but it might be shifting more and more into the blue orbit. Mayor Ko enjoys much more popularity with blue voters than with green voters these days (though he is still strongest among neutral voters). (The my-formosa polls have interesting data on the presidential contenders, but that is a rabbit hole for another time.)
There is a cottage industry of pundits who are constantly proclaiming that the dominant trend in party ID is dealignment. That is, what we really see are voters not identifying with any party. These people are wrong. In this data series, the percentage of unaligned voters is usually around 35%, though this there are fluctuations up and down. The only trends away from this tend to be fairly fleeting. So June and July were a bit higher, but August is back to normal. If you look at longer trends, it is the same. In the ESC’s chart of the last 30 years, independents have been at about 40% since before Chen Shui-bian was president. Yes, the numbers in 2018 and 2019 were a bit higher, but that turned out to be ephemeral. Dealignment is not the story today, and it hasn’t been the story in the past. It wasn’t even the story in the early 1990s when over half of respondents declined to express preference for a party. Martial law was still a recent experience, and people were simply hesitant to tell a stranger they supported the opposition. These are not the droids you’re looking for. (Yes, I know those were, in fact, the droids they were looking for. But really, this isn’t the big trend in Taiwanese politics.) This is still a system with strong, meaningful parties.
The last thing I’ll show you is on economic confidence. Respondents are asked whether they have generally positive or negative views on the overall domestic economy. In the August survey, 33.9% had positive views but 64.3% had negative views. As you might expect, opinions had gotten quite a bit more negative in May, June, and July, and August was a bit of a rebound. But from an absolute point of view, isn’t 30% net negative a pretty bad result? Doesn’t this show that Taiwanese think the current economic strategy isn’t working?
That’s one interpretation, but I think it might be wrong. Taiwanese are generally pretty skeptical about the economy. Enough people can remember (or have heard of) the booming 1980s and 1990s that everything seems lousy in comparison. They are also constantly reminded that the PRC is growing at fantastic rates, and Taiwan’s economy doesn’t measure up. So the default answer for this question is going to be negative. Things have to be noticeably good to change that.
In the latest report, Tai Li-an helpfully included a chart of responses this question going back to 2006 (using his old data from Global Views and TISR surveys). During that entire timespan, positive views never reached 30% before the last six months of Tsai’s first term. Even in the headiest days of Ma’s push to pass ECFA and tap into the Chinese market (“Will 85°C be the next Starbucks?!?”), positive views only got up to about 25%. For most of the time, positive views were only around 10%. In that perspective, the current 33% in the aftermath of a Covid outbreak looks outstanding.
And this, as much as anything else, might explain why the outbreak has had such a mild effect on public opinion. Things seem to be going fairly well. Maybe it’s best not to overreact.
A month ago, I posted a story about public opinion in Taiwan as of May 2020. I looked at polling from MyFormosa, which publishes polls every month. The big takeaway was that – almost certainly because of its effective response to the Covid-19 pandemic – President Tsai, the central government, and (to a lesser extent) the DPP had all surged in popularity. Meanwhile, the KMT’s popularity had plummeted. I did not discuss the upcoming Kaohsiung recall vote in that post, but if you projected those results to Kaohsiung you should not have been surprised that the recall was successful in such a hostile partisan environment to the KMT. (Note: I was still surprised at just HOW successful the recall was.)
In that post, I issued one caveat. What I really wanted to know was whether opinions about national identity had changed, but unfortunately MyFormosa does not ask that question. I always tell people that attitudes toward national identity are the single most important indicator in Taiwan politics. If you can only know one thing, you should ask how many people think they are Chinese (to some extent) or how many people think they are only Taiwanese. Well, now I have some data on this.
Before I show you the results, let me explain why I care so much about this single indicator. In the 1940s and 1950s, American political scientists came to the understanding that voters don’t start each election with a clean slate. Instead, most people have a standing vote choice: all else equal they will usually vote for the same party they have voted for in previous elections. Different people theorized about this standing vote choice in different ways, but the field of voting behavior came to be dominated by the Michigan school, laid out in the 1960 classic The American Voter. The Michigan scholars’ theory was based in social psychology, and they pointed to what they labeled “party identification” as the single most important variable for understanding voting choices. They believed the simple question, “Are you a Democrat or a Republican?” could explain more than anything else.
Theoretically, they thought of party ID as a group identity. People think of themselves as belonging to groups, such as Catholics, union members, Red Sox fans, ethnic Italians, Texans, hunters, and so on. Some of these group identities are more fundamental to their sense of person than others. The Michigan scholars thought that party ID was one of the basic identities that most people have. I am a Democrat; people who think like I do and share my values are Democrats; this is who we are. In early works, they argued that you learned your party ID as a child on your parents’ knees and kept it until death. The only things that could change a party ID were personal or social cataclysmic events, such as getting married, converting to a different religion, the Civil War, or the Great Depression. Other than that, people tended to continue supporting the same party they had always supported. In fact, this stance tended to get stronger over time due to a mechanism called the perceptual screen. Partisans viewed the world through tinted glasses, and they could almost always interpret the news as evidence that their party and its values were correct and the other party and its lousy values were dead wrong.
In sum, they thought party ID was the most stable and basic political attitude that individuals held. Democrats might vote for Eisenhower because the respected his personal war record or Republicans might vote for Kennedy because they were Catholic, but those were short-term deviations. Party ID was stable, and most people most of the time would vote with their party.
It turned out that party ID was not quite as stable as those early scholars had believed. A famous panel survey in the early 1970s, in which the same respondents were interviewed three times at two-year intervals, showed that quite a few people changed their answers to the party ID question. The early 1970s were a turbulent time in American politics, but no one thought the USA was going through anything as cataclysmic as the Civil War. The theory had to be adjusted in face of the new evidence, and the 1970s and 1980s featured a lot of work about how people constantly update their party ID. Some even suggested that it wasn’t a group identity at all.
In the current era of highly polarized and even tribal American politics, the group identity theory of party ID looks better than it did in the 1970s. Even so, there are still a lot of Americans who don’t think much about politics and certainly don’t think that being a Democrat or a Republican is a core part of who they are.
With that background, let’s return to Taiwan. The two big parties have been building their support coalitions for decades, and the electoral returns show that they have fairly stable bases of support. There are surprises here and there, but it is certainly possible to think of these as short-term deviations from the normal patterns grounded in party ID.
However, as in the USA, there is ample evidence in Taiwan that party ID is not as stable or as fundamental to how people think about themselves as some might think. Of course, there are lots of people who always vote for the DPP and would sooner drink bleach than vote for the KMT. But there are also a lot of people who don’t have strong feelings about either one of the two big, established parties or any of the newer, smaller parties. If you look at polling data in party ID over the past three decades, there are lots of changes. Parties go up, and then they go down. Sometimes the surges and dives are quite sudden and dramatic. This isn’t to say that party ID is completely malleable and fluid; it is still one of the more stable attitudes in our surveys.
However, there is a better indicator. National identity fits that early conception of a group identity even better than party ID. Whether you see yourself as being at least somewhat Chinese or as only Taiwanese shapes much more of your everyday life than simply your political choices. This might affect which language you speak, how you practice your religion, what kinds of foods you eat, which school you choose, which person you fall in love with, how often you argue with your parents, and many other basic aspects of both political and non-political life.
Moreover, national identity is the foundation of the current political system. The Taiwan Voter (2017) argues that while the Michigan school identified the big three factors (party, candidate, issues, in declining importance), Taiwan has a fourth factor, national identity, that precedes and shapes those three factors.
Again, not everyone chooses to clearly define themselves as either somewhat Chinese or exclusively Taiwanese, but many do. The Election Study Center (ESC) asks the national identity question in every poll it conducts, and almost everyone can answer it. People understand this question, and they have an opinion about it. As a result, national identity tends to be the most stable attitude we measure. Of course, the lines go up and down a bit, but not nearly as much as for other variables.
The Taiwan Election and Democratization Study (TEDS) project does most of the political science survey projects in Taiwan these days. TEDS is governed by scholars from every major university and who individually hold every major political viewpoint. However, because we are scholars who care most of all about getting good data to answer our questions, there is less of an incentive to try to produce “good results” for one party or another. Moreover, since we intentionally do not release the data for three months, the media rarely reports any results. As such, this is the most reliable data that Taiwan produces. One of the projects that TEDS does are quarterly telephone surveys on satisfaction with government performance. These are conducted at the ESC, which I have been associated with for 25 years and where I currently hold a joint appointment. I can personally vouch for the integrity of these surveys. Everything we do is with the intention of getting the best possible data. We do not design questions, sampling protocols, or anything else with the intent of producing the “right outcome” for a particular political purpose.
The ESC has been asking the same question about national identity for three decades. “In our society, some people say that they are Taiwanese. There are also people who say that they are Chinese. There are also people who say that they are both. Do you consider yourself as Taiwanese, Chinese, or both?” 我們社會上,有人說自己是「臺灣人」,也有人說自己是「中國人」,也有人說都是。請問您認為自己是「臺灣人」、「中國人」,或者都是?
Every year, the ESC combines the results from every survey it has conducted over the previous year and puts out a chart showing the results of this question over time.
You can see that percentage of people calling themselves Taiwanese peaked in 2014 and then slowly drifted downward through most of Tsai’s first term. However, if you look at the longer trend and ignore the peaks and valleys, you can see that the green line has had a long and steady upward climb over the past quarter century. Research shows that generational replacement is the main driver of this long-term trend. As older people die, they are replaced in the population by younger people who are more likely to identify as only Taiwanese.
One thing that is noticeably missing in this chart are big peaks and valleys that seem to follow current political events. Can you see where the Red Shirt protests of the Chen presidency took place? Maybe, but only barely. Sure, there is a peak in Taiwanese identity in 2014 – the year of the Sunflower Movement – but it only goes from the mid-50s to just over 60, and then it drifts back down again to the mid-50s. 5% is important, but it isn’t an earthquake. Similarly, the line goes back up about 5% again in 2019, a year in which we heard constantly about events in Hong Kong. If you imagine a straight trend line drawn on top of the actual line, the actual line never gets more than 2-3% away from that straight trend line. This is about as stable as anything ever gets.
So now let me show you the most recent data from the quarterly TEDS telephone survey. Again, remember that this is from March so it is already three months old. Things might have changed by now (though there isn’t much reason to expect any major changes between May and June from the fairly stable results in the MyFormosa polls).
Since very few people say that they are only Chinese, I always combine the “Chinese” and “both” categories to get a category in which respondents consider themselves at least partially Chinese. This is the chart showing polls since Tsai’s inauguration in May 2016. Only the last data point comes after her re-election and might reflect the impact of the Covid-19 pandemic.
That last data point is a clear outlier. From 2016 to 2019, with the exception of the two late 2018 surveys as President Tsai’s nadir, the exclusive Taiwanese line is consistently between 55-60%. In December 2019 – right before President Tsai won re-election in a landslide – 60.9% of respondents identified as exclusively Taiwanese. Three months later in March 2020, that number skyrocketed to 70.3%. We have seen some large shifts before, but those were all changes within the historical range of outcomes. 70% is completely unprecedented. This is a big deal.
We don’t know if this number will stay so high, go even higher, or drift down to more familiar territory. If it does turn out to be a lasting change, it will affect Taiwan’s political environment in profound ways. We will have to wait to see about that. For now, just be aware that the recent changes in Taiwan’s public opinion are potentially much, much more significant than President Tsai’s fantastically high but probably ephemeral approval ratings.
I haven’t written much about the state of public opinion in Taiwan since the January election. It is hard to believe that only a year and a half ago, people were writing President Tsai Ing-wen off as a failed president. They weren’t just making things up; her polls were terrible and the DPP suffered a massive defeat in the November 2018 elections. However, over the course of 2019 she pulled off a stunning reversal of fortune. Last year in September, I wrote a post about six astonishing months. However, September 2019 was not her peak. The poll numbers for both her and her party actually got better in November and December, and she led her party to a decisive victory in January.
Let’s flash back to January 2012 for a moment. After four years of low polling numbers and weak – though hardly disastrous – midterm elections, Ma pulled everything back together and won another term. In retrospect, he had a fantastic campaign. His polling numbers peaked almost precisely in January 2012, when the KMT party ID briefly spiked up into the forties and his satisfaction briefly topped his dissatisfaction. However, almost immediately after election day, Ma’s numbers started plunging. I don’t have the exact figures at hand, but if I recall correctly, by his second inauguration in May his satisfaction ratings were already down in the twenties and they never got much higher for the rest of his presidency. It was certainly plausible that Tsai would have a similar experience. However, that is not how things have unfolded thus far.
The Covid-19 pandemic has dominated world news for the past four months, and Taiwan’s response has been far and away the best in the world. Of the wealthy countries that have the state capacity to document the extent of the virus, Taiwan has had the fewest cases. Only Taiwan and a few other countries have managed to avoid an economically devasting social lockdown. Of those, South Korea and Japan have had far more cases and deaths. Even New Zealand, which might have the second-best response in the world, has had to lock down for a while. People might argue that Taiwan has the advantage of being an island with only a few ports of entry. That certainly does make containment easier. However, South Korea, Japan, Australia, New Zealand, Sri Lanka, Madagascar, and a few other places (arguably Singapore) are also islands or effectively islands, and none of them have managed things quite as well as Taiwan. Taiwan’s economy has stayed open, the schools were only delayed for a couple weeks after the winter break, and life has continued more or less normally here. We all have TVs and can see that this is not how the rest of the world has experienced the pandemic. Taiwan has done better, and it should not be surprising that public evaluations of the DPP government are extremely positive. People like good governance.
I am going to look at a few polls from the MyFormosa website. As I have written before, these polls are supervised by Tai Li-an 戴立安, one of the most senior and well-respected public pollsters in the country. The MyFormosa polls historically tend to produce slightly better results for the DPP than some other polls, but it isn’t a very large partisan bias. More importantly, they publish a poll every month with the same questions and the same sampling and interviewing methodology so that we can track changes over time. They did not publish a poll at the end of January; I guess they were worn out from the election and needed a break. Conveniently, this gap helps us visually mark the pre-election and post-election periods.
Let’s start with evaluations of President Tsai. MyFormosa asks both whether respondents trust her and whether they are satisfied with her overall performance as president. For the moment, let’s focus on satisfaction. The story of most of Tsai’s first term was her dismal satisfaction ratings. In December 2018, she was nearly 50 points underwater. This led to the KMT election landslide, predictions of her political burial, and a primary challenge for the presidential nomination. However, November and December 2018 were the low point, and her numbers slowly improved. By November and December 2019, the last two polls before the presidential election, she was roughly 10 points above water. As dramatic as that reversal was, there was still more to come. In the last three months, her approval rating has been a nearly unfathomable 70%, 40-45 points higher than her dissatisfaction numbers. The Taiwanese population has historically been pretty stingy with approval ratings for presidents; I don’t think we have ever seen these sorts of numbers for this length of time. Of course, this can’t possibly be sustainable; her satisfaction ratings have to come down. Taiwan has highly developed partisan politics, and eventually those long-term ingrained political preferences will reassert themselves.
What about trust in Tsai? The responses to satisfaction and trust are very similar, and in the past I’ve just used one or the other. However, there is a little difference. Back when Tsai’s numbers were dismal, she always did a bit better in trust than satisfaction. For example in February 2019 she was 38 points underwater in satisfaction but only 28 points underwater in trust. That is, there was a group of people who weren’t satisfied with her performance but still trusted her to do the right thing. This was probably the easiest group of voters to win back during the 2019 campaign. At any rate, now that she is doing well, the gap between satisfaction and trust has almost disappeared. The people who aren’t on board now are really not on board. That last 25% is probably never going to express any sort of positive opinion toward her.
MyFormosa also asks about satisfaction for the premier, but it’s pretty much the same story so I won’t tell it again. Premier Su is pretty popular these days.
A more interesting question is how people feel about the economy. MyFormosa asks whether they have a positive or a negative evaluation toward the overall domestic economy. This month, 68.2% gave a negative evaluation and only 28.5% gave a positive evaluation. That sounds pretty pessimistic. However, you have to remember two things. One, the world economy is objectively terrible right now, and Taiwan is highly integrated into the world economy. Two, as I keep saying, the Taiwanese public is historically pretty stingy in giving out good evaluations. A look back at the previous year show that the current evaluation is the worst since about last August. Think about that. The United States is talking about the worst economic crisis since the Great Depression 90 years ago. In Taiwan, it’s not even the worst people have felt in the last calendar year. In fact, if you look at the February and March 2020 results, when the pandemic was still mostly confined to China, people here were relatively optimistic. Taiwan has been active in trying to find economic opportunities, such as filling orders that shuttered Chinese factories could not and encouraging the movement of supply chains out of China. The numbers got quite a bit more pessimistic in April, when the American and European economies came under attack. Still, because the economy is open, we get a fair share of good domestic economic news to go along with the horrible international economic news. In this global environment, I’d have to say that the public’s economic evaluations are actually quite sunny.
This is a blog about elections, so I ultimately care about how public opinion refracts back on politics. We are over two years from the next general election, so at this stage I care about the deeper, long-term orientations. What I really want to know right now is whether these four months have affected national identity. After all, Taiwan has spent much of the last few months insisting that it is not China while having the rest of the world clumsily step on that painful nerve. I would not be surprised if the percentage of people saying they are Taiwanese and NOT Chinese has risen. However, MyFormosa does not ask the Taiwanese/Chinese question, and I haven’t seen results on this anywhere else. I guess we’ll have to wait until late June for the March TEDS results or, better yet, until late September for the June survey. I always tell people that if you can only have one number about Taiwanese politics, you should ask for the percentage of people who self-identify as exclusively Taiwanese. Unfortunately, we just don’t have that number right now.
What the MyFormosa data can tell us something about is how the parties are doing in the period since the election. The short answer is that the DPP is doing a little better and the KMT is doing quite a bit worse.
Here is the chart for party ID. In the post-election period, the line for the DPP is up slightly from the pre-election period. (In my mind, I’m comparing the four post-election data points with the last four or five pre-election data points.) The line for “other green” is also slightly higher. [note: MyFormosa always includes categories called “other blue camp” and “other green camp.” I’m not quite sure how they ask this, but those two responses always get quite a few respondents.] The most dramatic difference, however, is for the opposition. The KMT line is markedly lower after the election. More surprisingly, the “other blue” category is also lower. One might have thought that dissatisfied KMT supporters would stay somewhere in the blue camp, but that isn’t what has happened.
I don’t have much to say about the three smaller parties. There doesn’t seem to be any clear change for them.
You can see the patterns for the big parties more clearly by just looking at the aggregation of party support into camps. When the green camp hit the low 40s just before the election, I thought that it had to be an anomaly. They’ve never had that kind of support, and, anyway, it couldn’t possibly last. Six months later, that number is still in the low 40s. Color me surprised. However, the bigger change is in the blue camp, which these data say is in an absolute crisis. Under Han Kuo-yu’s leadership, the KMT hemorrhaged support all through 2019. Who knew that it could get quite a bit worse? In the last poll before the election, the green camp lead over the blue camp was 17.4%. Tsai beat Han by 18.5% and the blue camp (Han plus Soong) by 14.3%. In the May poll, the green camp lead is 26.0%. How much would she win by today? How big would the DPP’s legislative majority be today?
MyFormosa groups respondents into nine categories depending on how they feel about the two big parties. There are three pro-DPP categories, three pro-KMT categories, and three neutral categories. You can see the same partisan trends here, with the green groups at the top dominating about the same proportion of the population since last November, and the three blue categories at the bottom compromising a pathetically small portion of the chart.
One of the interesting things about this table concerns two of the neutral categories. Group 4 includes respondents who like both parties, which Group 6 includes people who dislike both parties. A year ago, angry Group 6 was much larger than amiable Group 4. Now, they are about the same size. If you read my blog last year, you might remember that Ko Wen-je dominated Group 6. Han Kuo-yu did pretty well among Group 6 in the early 2019 polls, but they increasingly rejected him as the year went on. I suspect Group 6 is one of the primary engines fueling the 2018 populist wave, and I’m happy to see it shrinking a bit. I hope this is a result of witnessing good governance.
I saved what might be the scariest chart for the KMT until last. So far, the picture has been that people think the DPP government has done a good job, but that really hasn’t paid off in clearly higher partisan support. The DPP’s relative position has improved because the KMT has suffered a loss in support.
MyFormosa asks respondents how they feel about the two big parties, whether they have good feelings 好感 or bad feelings 反感 about them. Since the election, the KMT’s chart has gotten a bit worse. More respondents have bad feelings than good feelings, and the gap grew from about 30 points before the election to 38 points in March (though it has narrowed again in May).
The chart for the DPP is more dramatic. Before the election, good feelings toward the DPP outweighed bad feelings by about 6 points. In February, that gap exploded to 29 points. Even after narrowing in May, it is still 22 points. The good feelings have increased, but the bad feelings have decreased by even more. In other words, four months of good governance seem to have taken some of the vitriol toward the DPP out of the system. Think about the people who don’t support the DPP and will probably never vote for it. Fewer and fewer of those people are expressing outright bad feelings about the party. The DPP’s support rate might not have noticeably increased over the past few months, but this sort of emotional shift – the lack of poison in people’s guts – could slowly yield dividends over the long term.