Archive for the ‘2014 mayor’ Category

campaign trail: KMT event in Taoyuan

December 28, 2015

After Sunday afternoon’s presidential debate, Mrs. Garlic and I headed off to a KMT evening rally in Taoyuan. The rally was to open the northern Taoyuan campaign office. Taoyuan is traditionally split into the Min-nan north and the Hakka south, so this district was responsible for the three predominantly Min-nan districts (Taoyuan 1, Taoyuan 4, and Taoyuan 6). Taoyuan 6 is probably not competitive, and the DPP didn’t bother to nominate its own candidate. However, Taoyuan 1 and 4 are two districts that I am watching with keen interest. Of the three predominantly Hakka districts, Taoyuan 2 looks likely to go to the DPP, while Taoyuan 3 and 5 are probably not in play. The common thread in the three solid blue districts is a large military and mainlander population.

Every time I look at the 2012 and 2014 election results from Taoyuan, my brain hurts. The numbers just don’t make sense. Two decades of election observation tells me that patterns of competition in Taiwan are quite stable. Then 2014 blindsided me. The rest of the world paid attention to Taipei and Taichung, but Taoyuan was the race that shocked me and convinced me that something very fundamental had shifted.

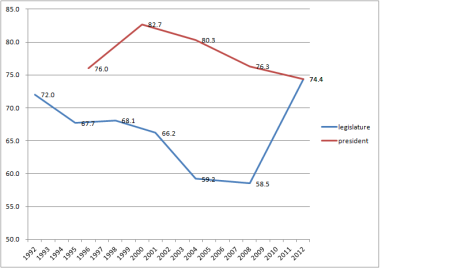
Let’s look at some numbers. In 2012, the KMT won all six legislative races and Ma won the presidential election by a sizeable margin.

  Ma Tsai KMT LY DPP LY
1 54.4 42.7 55.3 44.7
2 52.5 44.6 50.2 49.8
3 60.7 36.4 53.9 39.9
4 56.0 41.1 58.2 40.6
5 60.9 36.1 45.3 35.1
6 59.1 37.8 60.3 31.3*
all 57.2 39.9 53.9 40.4

*In D6, the DPP supported an independent in 2012. This year, they are supporting a different independent in D6.

In 2012, the DPP had two incumbents, since they had won by-elections in Taoyuan 2 and 3. Note that these two candidates ran strong races, but both were unable to overcome the partisan disadvantage. The KMT candidates in D3 and D5 lost significant numbers of votes to 3rd party candidates.

Those are big margins, and there is very little hint that the DPP might be competitive anywhere except perhaps its traditional coastal stronghold (D2) any time soon. Now here are the 2014 elections, in which the DPP somehow reversed all these numbers. I have also broken down these results by legislative district. The third and fourth columns are the city council results, which I’ll get to later.

  Wu (KMT) Cheng (DPP) KMT CC DPP CC
1 43.4 55.6 43.2 38.4
2 47.5 51.3 30.4 41.8
3 52.1 46.9 35.4 24.3
4 42.6 56.4 44.2 31.6
5 52.0 47.0 35.4 22.8
6 50.0 49.0 35.1 33.3
All 48.0 51.0 37.1 32.2

Comparing Wu to Ma, the KMT lost an average of 9.2%, with much lower losses in the (more rural) coastal D2 and higher losses in northern D1 and D4. Perhaps it isn’t surprising that Wu’s losses were higher in northern Min-nan D1, D4, and D6, since Wu 吳志揚 is Hakka and Cheng 鄭文燦 is Min-nan. This year, most legislative races will pit Hakka against Hakka or Min-nan against Min-nan, so there won’t be a big ethnic advantage in any locale. In other words, all else equal, the DPP might not do quite as well as Cheng in D1, D4, and D6, but it might do a bit better in D2, D3, and D5. Still, it appears to me that D1 and D4 are at the epicenter of whatever was driving last year’s earthquake. In particular, the area that changed most dramatically is the region from Guishan to Taoyuan, roughly the stretch along Freeway #1 closest to the Taipei metro area.

There are many people who would like to dismiss the 2014 result as a function of a strong DPP candidate and a weak KMT candidate. However, this is not consistent with survey data. TEDS did a pre-election survey (about 3 weeks before the election). One of the questions asked people rate how much they liked each candidate on a scale of 0 to 10. 36.4% rated Wu higher, while only 28.6% rated Cheng higher. Another question asked what the most important issue was and then asked who would be better at handling that issue. Most people didn’t give an answer, but of the ones who did, 18.3% thought Wu would be better while only 13.9% though Cheng would be better. Remember, this is AFTER the corruption scandal involving Wu’s deputy mayor. Voters didn’t elect Cheng based on his personal popularity.

If it wasn’t the candidate, it almost necessarily had to be the party. TEDS did a post-election survey after the 2009 county magistrate election, and found that the KMT had a 39.9-24.7% edge in party ID. I don’t know what the numbers were in Taoyuan in 2012, but the national numbers were fairly stable during Ma’s first term. I imagine they weren’t far from 40-25%. In the 2014 pre-election poll, the party ID numbers were completely different, with the DPP leading 26.8-26.2%. In other words, the KMT went from a 15.2% advantage in party ID to a 0.6% deficit. This is what propelled Cheng into the mayor’s seat.

How do those numbers translate into legislative districts? I suppose I could break them out, but I won’t for two very good reasons. First, I can’t do it precisely. Since Taoyuan and Zhongli districts are split among different legislative districts, I’d have to know which neighborhood each respondent lived it. TEDS did not ask that question. Second, even if I could do it, I probably shouldn’t. With a total sample size of 1000, each of six districts would have a sample size of less than 200. If your subsample doesn’t have at least 400 respondents, it is probably too small to tell you anything useful. (Remember this the next time you look at survey results. The media is always breathlessly reporting results based on tiny subsamples.)

Instead of giving precise numbers, let’s do this qualitatively. If the two parties are tied in PID overall, we can certainly guess that the KMT has an advantage some areas while the DPP has an advantage in others. In particular, the KMT probably still has an edge in D3, D5, and D6. This must mean that the DPP has an edge in D1, D2, and D4. I don’t know how big those edges are, but I’m pretty sure that the three KMT incumbents in D3, D5, and D6 are effectively running downhill, while the three KMT incumbents in D1, D2, and D4 are running uphill.

To put it another way, given Tsai Ing-wen’s enormous lead in the polls right now, she will probably beat Chu in all six of Taoyuan’s legislative districts. She will probably also win an outright majority (beating Chu plus Soong) in D1, D2, and D4. The question then is whether those KMT incumbents can create enough split tickets to make up the deficit.

I’m most skeptical about Liao Cheng-ching 廖正井, the KMT incumbent in D2. Liao won the district eight years ago, but he had the seat stripped due to vote-buying and the DPP won the seat in a by-election. Liao’s conviction was overturned on appeal (on what I consider dubious grounds) just before the KMT finalized its 2012 nominations. Since he was no longer ineligible, the KMT reshuffled its plans and nominated him. He squeaked out a razor-thin victory, running behind President Ma and well behind the larger blue camp vote. He has had four years to work the district, but I’m not convinced he has ever been that strong. This year his opponent is also a Hakka from Yangmei, so he can’t call for local or ethnic solidarity. (According to her Wikipedia page, the DPP’s husband has a spotty criminal record (read: he is/was in organized crime). So this race is between a gangster’s wife and a convicted vote buyer. Hooray for democracy!) I think Liao is probably going down.

The other two are harder to predict. Chen Ken-te 陳根德 (D1) has been in the legislature since 1998, and Yang Li-huan 楊麗環 (D4) has been in since 2001. Both came up from the grassroots. Chen was previously in the county council, where he served a term as speaker, while Yang started her career as a neighborhood chief. These two have been working grassroots connections forever. Of all the competitive districts this year, these might the two with the strongest personal bases. They’re certainly in the top five. Will that be enough to overcome the partisan deficit?

Go back to those city council results. There is quite a gap between the mayoral results and the council results. The mayoral election is essentially a national-level fight. Voters think of it in national partisan terms. It’s not too much to suggest that a vote for Wu was a vote of confidence in President Ma while a vote for Cheng was a vote against Ma and for Tsai. The city council vote was much more local. Some voters voted on national partisan considerations, but many voters made their choices based on local networks, patronage, friendship, family recommendations, local development projects, constituency service, and so on. Independent candidates don’t have much space for survival in national politics (unless they are actually running as the unofficial representative of one of the big parties), but independents got significant numbers of votes in every city council district. In some, independents got as much as 40% of the vote. Even in D4 (Taoyuan), which had the weakest set of independents, independents still got over 10%. Moreover, since independent candidates usually take most of their votes from the blue pool, many people who vote for the DPP in national-level elections are voting for the KMT in local-level elections.

Technically, a mayor is a local official while a legislator is a national-level official. However, a mayor is much higher up the chain of power. As I have said many times, municipal mayoral winners are automatically on the short list for the presidency. In contrast, many legislators treat their office like a glorified township mayor, spending much more time worrying about the state of local roads or constituency service than on national legislation. In other words, when it comes to voting, a legislator is significantly more local than a municipal mayor. The KMT legislators in D1 and D4 are particularly locally-oriented, and they would love for voters to see these races as local contests. The critical question, then, is whether voters will make their choices thinking about President Ma or the project to upgrade their local playground.


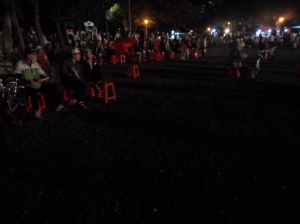
The rally was in a tiny space right next to the campaign office. I’ve never understood why organizers feel the need to hold rallies right next to the office just because the rally has been designated as an office-opening event. We were jammed into an intersection of two narrow streets. The crowd couldn’t spill out off the streets because we were in the middle of muddy fields. I don’t think it was possible to jam more than 2500 people into the cross, and most of them had terrible viewing angles. The crowd had almost all been bused in, and it was dead.

Let me pause here for a digression. A couple weeks ago, I went to the rally to open Chu’s southern Taoyuan campaign office. It was huge, with maybe 12,000 people completely filling a huge space. I had to squeeze along the edges for about 15 minutes just to find some open space. It wasn’t just big. It was rocking! It might have been the most enthusiastic rally I’ve been to this year. Chu wasn’t doing well at all nationally and the Jennifer Wang 王如玄 controversy was breaking wide open, but his people in Taoyuan turned out in force to support him. It was an emotional display unlike anything I’ve seen in New Taipei or anywhere else. Chu was their boy, and they were behind him 100%. I thought I would be going to a similar rally last night, but it wasn’t anything like the one two weeks ago. Last night’s rally was tiny and cold. Two weeks ago, the atmosphere was raucous, defiant, and maybe even optimistic. Last night, it was defensive and maybe a little defeatist. I’m not suggesting the campaign is running out of steam or anything like that. I’m just surprised that the people in one office in one part of Chu’s hometown could organize such a great event while the people in the other part did such a terrible job.

It wasn’t entirely the audience’s fault that they were bored. This event had one of the most uncharismatic lineups of speakers that I have ever sat through. Chu’s former deputy magistrate was almost a caricature of a droning bureaucrat, and he was supposed to be the person whipping up a fever for Chu’s big entrance. Who decided to let him near the microphone? More surprisingly, the three legislative candidates were also pretty bad at public speaking. I guess they must be REALLY good at constituency service.

Chen Ken-te remarked that the KMT still hadn’t emerged out of the shadow of last year’s election debacle. He then explained the reason for that defeat: the KMT had let down its guard and hadn’t fully mobilized. In other words, Chen was insisting that there is no need for the KMT to engage in any painful soul-searching or reform. They just need to make sure they mobilize all their voters. A couple other speakers echoed this theme. One of them talked about the 40% of voters who are hesitant to tell survey interviewers that they support the KMT. Presumably, he was assuming that the 40% undecided are all going to vote for Chu, so the KMT is actually well on its way to winning this election. These people who are willfully ignoring all the signs of the impending disaster! They are like children putting their hands over their ears and screaming “La, la, la, I don’t hear you!”

The city council vice speaker touched on another prominent theme: the KMT has a sparkling record in local politics. He claimed that under Chu and Wu, Taoyuan had a better record of local development than any other city or county in Taiwan. Several of them pointed to the area we were in, which was a newly redistricted area and had several building projects. They also talked proudly about the plan to develop the land around the airport. When Eric Chu spoke, he pointed to a new road he had overseen that was now lined with tall buildings. This was not your ordinary laundry list; they were genuinely bragging about what they considered to be a great job. As one of them wondered, How can the voters possibly vote against us after we have done all this?

I think this might be precisely where they are failing. Every time I go to Taoyuan, my impression is that Taoyuan is, well, difficult. The cities are particularly cramped, the roads are too narrow, the water quality and supply is terrible, industrial pollution is a problem, and there just isn’t enough public infrastructure. Things might get better after the MRT lines open and they might be better in the newly developed areas, but I think the old neighborhoods where most people live are still going to be difficult. As for their vaunted land development, I wasn’t that impressed. These were former agricultural fields that they could have done anything with. I saw lots of narrow streets that will be inadequate to support the large populations in the tall buildings they are planning. It’s as if no one makes any profit by building wider roads. We are still reaping the benefits of the Japanese bureaucrats who built wide roads in downtown Taipei and Kaohsiung. Future generations will wonder why KMT planners couldn’t do the same in Taoyuan. When KMT politicians crow about their great construction achievements, I wonder if they don’t alienate more people than they impress.


I have one more note about the D4 race that doesn’t seem to fit in anywhere, so I’ll tack it on at the end. The DPP candidate in D4 is an old warhorse, Cheng Pao-ching 鄭寶清. He has been around since the mid-1990s, but he never made much of an impression on me. During the second Chen term, he lost the 2005 magistrate election, and he was then given a sinecure as the head of the Taiyen (Taiwan Salt) corporation. Mrs. Garlic tells me that he was the one who spearheaded Taiyen’s highly profitable move into the cosmetics market. Wikipedia says he has founded three biotech companies since leaving Taiyen. But that’s not the fun part. A week or so ago, I went to a rally for Chen Lai Su-mei 陳賴素美, the DPP candidate in D2. Apparently, she once worked as Cheng’s aide, so Cheng showed up to stump for her. I only remember one thing he said. He is the thirteenth child in his family. There are sixteen altogether. All sixteen have the same mother and the same father, and mom gave birth to sixteen kids in sixteen years. When Tsai Ing-wen showed up, I couldn’t help but remember that she is the eleventh child. Can you imagine someone having sixteen or eleven children today? In all the ways that Taiwan has changed over the past centuries, this might be one of the most dramatic.

turnout and China

December 18, 2015

Every now and then, someone will see a chart like this one and wonder what is wrong with Taiwan’s democracy.

turnout.png

This chart clearly shows that turnout has declined during the quarter century of democracy here in Taiwan. You can see one important reason the Central Election Commission chose to hold legislative and presidential elections concurrently: the turnout for legislative elections is about 20% in concurrent elections (like in 2012) than when legislative elections are held by themselves.

There are a few reasons that we could talk about for the turnout rates in individual elections. The 2000 and 2004 presidential elections were particularly intense, so turnout was probably particularly high. The 1998 legislative election was held concurrently with mayoral elections in Taipei and Kaohsiung, so higher turnout in those two cities pulled up the national average. The 2008 legislative and 2012 elections (and the upcoming 2016 elections) were held close to the Lunar New Year holiday, so many voters living elsewhere might have been hesitant to make two trips back to their official residence within a short time. However, even considering about all this, I think it is fair to say that there has been a decline in turnout over time.

There is one more factor that people rarely talk about. There have always been a significant number of Taiwanese who live outside the island. For example, my guess is that the number of Taiwanese living in the USA is probably similar to that number in the mid-1990s. However, the number of Taiwanese living in China has skyrocketed over this period. No one has a good number for this. People commonly throw around round numbers like one or two million Taiwanese in China. One of my mentors thinks it might be as high as four million, based on staring at years of survey results. Again, no one knows what this number is (though lots of people will tell you they know), and the government does not seem to publish this number. Let’s just assume that the number is two million Taiwanese living in China. That means that nearly 10% of Taiwanese live in China. Presumably, they include a higher proportion of adults than the population at large, so they could easily comprise over 10% of the electorate. Look at those slides in turnout again and think about the 10% missing voters. The China population could account for the entire decline.

But wait, you say! Those people can still vote. Sure, they have to return to Taiwan, but there are lots of extra flights (at cheaper prices) every election. There is a massive mobilization effort each time by the KMT, the Taiwanese business communities, and the PRC to get those people back to Taiwan and into voting booths. After all, the KMT and PRC both assume that Taiwanese living in China will overwhelmingly favor the KMT, so they have a strong incentive to turn out that vote.

Well, we can actually look at some numbers. Spoiler alert: most people don’t come back to vote.

I started this inquiry stupidly, by counting the number of flights landing in Taiwan from China every day. Today, Friday, December 18, 107 flights landed at Taoyuan, Songshan, and Kaohsiung airports. Tomorrow, 82 flights will land. I’m going to assume yesterday represents all weekdays and tomorrow represents all Saturdays and Sundays. Let’s assume that no one will return to vote more than a week before the election. So in the average week before an election, about 700 flights from China will land in Taiwan. If each flight has 200 seats, that makes 140,000 arrivals. Assume all of those are voters (no Chinese tourists, no one makes two flights, no children, no one goes back before Saturday…). There were 18,086,455 eligible voters in 2012 (it will be higher this year), so those 140,000 would constitute just under 1% of the electorate.

But wait a minute. Taiwan is the best in the world when it comes to open data. Can’t I get some better number than that? You betcha! The Civil Aeronautics Administration publishes data on arrivals. Scroll down this massive 2014 annual report to page 177 (Table 49, 3rd panel), and you find that in 2013 33,538 flights with 7,215,056 seats, and 5,566,967 actual passengers arrived from China. Divide those numbers by 52 to get the average week, and you have 645 flights with a capacity of 138,751 seats, and an average of 107,057 actual passengers per week. So it appears my back of the envelope numbers were too large.

Note that in December 2014, when there was an election, the number of arrivals wasn’t much different from August-November. In fact, a news story I found floating around on the internet said that airlines added 46 extra flights coming from the USA, Japan, and other countries for the 2014 election period, but there were already enough seats on the China flights to meet demand. That seems to be the case, since only 76.0% of the seats were filled.

Perhaps you think that a presidential race is different from a local mayoral race. Well, here is the 2012 report. Again, the data you want are on Table 49. There were fewer overall flights, seats, and arrivals in January 2012, but January 2012 does not look that much different from March or later months. (February is lower because of the holiday.)

We can do better than that, though. The National Immigration Agency keeps statistics on how many Chinese enter the country. The overwhelming majority of Chinese in Taiwan are tourists, and these enter almost entirely by airplane. There might be some who come through third countries, but, for simplicity, let’s just assume that every Chinese tourist displaces a potential voter. In 2014, 3,328,224 tourists arrived, a weekly average of 64,004. Since there were 107,057 passengers a week, that only leaves 43,053 spots a week for Taiwanese voters. Everyone assumes that there will be fewer Chinese tourists as we get closer to the election. This story in Liberty Times estimated that the daily number of Chinese tourists might decline by as much as 40%. (Surprisingly, I don’t see any evidence of this sort of drop in the 2014 arrivals data.) This would imply about 38,000 Chinese tourists in the week before the election, leaving about 69,000 seats for Taiwanese voters. 69,000 votes would constitute about 0.4% of the 2012 electorate.

You can make objections that this number is too low. Some people will travel through Hong Kong, Macau, Tokyo, Seoul, or other points to get from China to Taiwan. However, you can also argue that the number is too high. Some of those seats will be filled by children, people who return to China before the election, Americans, and other people who won’t vote in the election.


In short, a large number of voters – maybe 10% of the electorate – live in China, and only a very small number – maybe 0.5% of the electorate – will come home to vote. In effect, these people have voluntarily taken themselves out of the electorate. If these are predominantly blue camp sympathizers, as nearly everyone assumes, this is a tremendous boost to the DPP push for the presidency and a legislative majority. Wouldn’t it be ironic if one of the primary effects of the KMT and PRC’s push to integrate Taiwan’s economy into China’s were to effectively remove an enormous block of pro-integration voters from the electorate, thus making political integration less likely?

Declining KMT Party ID

June 28, 2015

I’ve spent most of the past week digging through mountains of data from the Taiwan Election and Democratization Surveys (TEDS) trying to put together a paper proposal for a conference later this year. As a side effect, I have lots of stuff to share on my blog.


After last year’s elections, I lamented that we would never be able to completely figure out what happened in the two most important elections, New Taipei and Taoyuan, since TEDS was doing the big post-election face-to-face surveys in Taipei, Taichung, and Kaohsiung. Happily, I was wrong. In addition to the major surveys (which will be released in the next few weeks), TEDS also did pre-election telephone surveys in New Taipei, Taoyuan, Yilan, and Yunlin. Even better, TEDS has conducted national surveys quarterly since September 2012. As a result, there is a lot of stuff to dig through, and I might be able to come up with a more complete answer for why the KMT lost Taoyuan and barely won New Taipei.


Blue supporters are mostly ignoring last year’s elections. They don’t matter. They were local, not national elections. People just wanted to express dissatisfaction with President Ma, but they’ll come back to the KMT in national elections when it really matters. The KMT had lousy candidates. Whatever the reason, I keep talking to KMT true believers who think the KMT is in good shape for next year’s elections. They aren’t convinced that Hung Hsiu-chu can’t beat Tsai Ing-wen, to say nothing of the possibility that the KMT will lose the legislature.

Those objections are a little correct, but they are mostly wrong. Local elections are a bit different, but mayoral elections still run largely along party lines. The bigger the city or county, the more nationalized the election is. Hualien and Hsinchu County had weird, local things happen, but that type of thing is a lot less likely in a direct municipality. Sean Lien was a historically awful candidate in Taipei City, and he managed to single-handedly lose that race. However, the KMT candidates in Taoyuan and New Taipei were both more highly rated than their DPP opponents. Candidate quality can’t explain the poor KMT performance in those races.

Then there is party ID, which is what I’m really going to write about today. To put it bluntly, the KMT has suffered a massive decline in its party ID over the last four years, and party ID is one of the most important variables in all of political science. You can see this decline in data from TISR and the Election Study Center, NCCU, pictured below. From the late 1990s until 2012, party ID was fairly stable. The blue camp, mostly the KMT, had a consistent lead of about 5-10 points over the green camp, mostly the DPP. Not coincidentally, the blue camp consistently had about a 10% edge in most elections. In hindsight, the 2012 election might be both the most “typical” election result and also the last election of that party system.

PartyID (2)

A quick review. Party identification has two classic conceptualizations. The social psychologists of the Michigan School thought of party ID as a group identity. Someone would identify themselves as a Democrat in the same way they would identify themselves as a Catholic, a German, a Red Sox fan, or a union member. All of those identities define who the person is, so Democratic identifiers usually vote for Democratic candidates because they are both part of the same meaningful group. A person who ceases to identify as a Democrat is telling you something very substantive and meaningful about how he or she has changed. The other way to conceptualize party ID is as a running tally. This idea has its roots in the rational choice school of thought that comes out of microeconomics. According to this school, every time something happens, a voter updates his or her current opinion of the party. If something negative happens, the voter’s opinion is lowered. This running tally is then a summary of how the voter currently sees the party, and it is a good information shortcut to use in the voting decision. In Taiwan, party ID is usually operationalized as asking the voter, among parties A, B, C, D, and E, which party do you support more? A long list of studies over the past twenty-five years have shown that party ID is a powerful indicator of vote choice in Taiwan, just as in the rest of the world.

Here is the TEDS party ID data for the past four years.

kmt party ID 1

The first data point is from rolling telephone surveys in the five weeks before the 2012 election. The second data point is from the post-election face-to-face survey, which was mostly conducted during the month after the election. The remaining data points are the quarterly telephone surveys. The surveys before and after the 2012 had large samples (n~5000, 2000), which the quarterly surveys had about 1000 interviews each. In some of the following graphs in which the data are cut into several categories, the quarterly data will jump around a bit more, reflecting the larger sampling error. The DPP held steady at around 25% through most of the period, but it has been above 30% in the two most recent quarters. Of course, the December 2014 data are critical, since they were taken right after the election. The KMT data is more dramatic. KMT party ID had a spike up from its normal 35% or so right before and after the 2012 election. By the time the quarterly data start in Sept 2009, this spike is completely gone. The KMT continues to bleed support, with a noticeable plunge in Dec 2014. Comparing the two elections, the KMT crashed from 43% in late 2011 to 23% in late 2014.

What’s amazing to me about this plunge is how it happens in nearly every sub-population. Maybe you think young people are abandoning the KMT. They are, but not any faster than old people. (I ran a binary logistic regression model on this for the Sept 2009 to Dec 2014 period, and the slopes of the individual lines are not statistically different from the slope of the overall line.)

kmt party ID 2

Education isn’t the answer. All these lines go downward at just about the same rate. (Region and gender don’t show any differences either, but I’ll spare you those charts.)

kmt party ID 3

Occupation is not quite uniform. KMT support among government employees (the blue line) declines at a slightly steeper slope. The red line for students is just about at the average until the June 2014 survey, when it plunges dramatically. It is as if a generation of students were radicalized or something! Statistically speaking, my model showed that the slope of the student’s line was more negative than that for the government employees. However, since students are a small group, their coefficient was not statistically significant.

kmt party ID 4

There is a clear trend in ethnic background. Support for the KMT declined much less rapidly among Hakkas than among Mainlanders or Min-nan respondents. (I wish the sample sizes were large enough to analyze Aborigines, since there are hints of massive changes from the electoral returns.)

kmt party ID 5

There is one more demographic variable that I find intriguing. I recoded all the townships into four categories. The first is the “urban core.” This includes all the prosperous parts of the major cities. The second is the “urban sprawl.” This includes the decaying downtown sections as well as the new growth overflow suburbs. Most of New Taipei and Taoyuan are in this second category. If money were no object, almost everyone would choose to live in the posh first category rather than the (comparatively) low-rent second category. The third category includes rural Min-nan townships. This category is dominated by the stretch of townships in the rural south from Changhua to Pingtung. The fourth category is much smaller and includes all the other rural townships. This group is dominated by predominantly Hakka townships, though it also includes a large number of (sparely populated) Aboriginal townships. There lines are different, especially if you limit the sample to the period from Sept 2012 to Dec 2014, as my model did. Support for the KMT among people in the rural diverse townships did not decline much at all. This is similar to the trend among Hakkas that we saw above, but it is even stronger here. It is possible that preferences among rural Hakkas have been more stable than those among urban Hakkas (though I haven’t tested that idea). The bad news for the KMT is that their best group is by far the smallest. The largest category is group 2, the urban sprawl. In this group, support for the KMT plunged the fastest. It’s hard to see in this picture, but the difference is statistically significant. TEDS telephone surveys don’t ask respondents for income information since that is too sensitive to do on the phone, but an obvious interpretation is that poorer urbanites are abandoning the KMT ship faster. This might be evidence of the emerging class cleavage.

kmt party ID 6

The variations among subgroups are interesting, but the main takeaway point from this post is the main trend. Those big, black lines in the middle of each graph are moving relentlessly downward. The KMT can tell itself that this doesn’t matter. All those newly undecided voters will come back to the KMT when national power is at stake. That’s what the DPP told itself in 2007. That didn’t work out so well for the DPP, and the dip in DPP party ID in Chen’s second term was much smaller than the dip in KMT party ID during Ma’s second term. Whether people are no longer expressing a group identity with the KMT or their running tallies no longer put the KMT in a favorable position, this drop in KMT party ID is almost certainly the main cause of the KMT’s 2014 debacle (outside of Taipei). Unless things turn around in a big way, it is also almost certain to have a major impact six months from now.

Translating mayoral votes into legislative seats

December 13, 2014

The DPP won a smashing victory over the KMT two weeks ago. If those results are duplicated in the legislative elections coming up in a mere 13 months, the DPP will take firm control of the legislature. Of course, you can’t assume that the mayoral vote will be replicated. For one thing, all those national issues (ie: 92 Consensus) that largely stayed off the agenda will be unavoidable in 2016. For another, the candidates will be different. The KMT will be fielding a roster of quality incumbents while the DPP will have a higher share of unproven challengers. Still, these results should scare the pants off of some incumbent KMT legislators. In this post, I’m going to look at who should be the most terrified.

In 2012, the DPP won 40 seats and the TSU took 3, so the green camp needs another 14 seats to win a majority. They probably shouldn’t count on keeping the Taitung seat, since the KMT vote might not be split next time. So let’s see how likely it is that the DPP can win 15 more seats.

Legislators will be ranked from one to four, with four exclamation marks being the most alarmed.

The south

Lin Kuo-cheng 林國正, Kaohsiung 9  (!!!!)

2012 LY DPP: 32.3%;      2012 Tsai: 56.1%;   2014 DPP: 71.6%

Weng Chong-chun 翁重鈞, Chiayi County 1  (!!!!)

2012 LY DPP: 49.7%;      2012 Tsai: 58.8%;   2014 DPP: 60.0%

Chang Chia-chun 張嘉郡, Yunlin 1  (!!!!)

2012 LY DPP: 49.6%;      2012 Tsai: 56.2%;   2014 DPP: 55.6%

Wang Chin-shih 王進士, Pingtung 2  (!!!!)

2012 LY DPP: 51.5%;      2012 Tsai: 51.1%;   2014 DPP: 59.7%

Huang Chao-shun 黃昭順, Kaohsiung 3  (!!!)

2012 LY DPP: 46.1%;      2012 Tsai: 46.6%;   2014 DPP: 63.7%

Lin Kuo-cheng holds the Kaohsiung 9 seat because Chen Shui-bian’s son split the DPP vote. This district is so solidly green that the DPP might take it back even if they split the vote again.

Weng Chong-chun and Chang Chia-chun won improbable victories in 2012. If this election is any indication, they won’t be able to repeat that feat in 2016. In 2014, Weng ran personally and Chang’s aunt ran in Yunlin. Both were resoundingly thumped in their own legislative district. Chang’s father has already announced the family won’t be running for re-election. I expect Weng will give it a try, but he is trying to run up an ever steeper hill. At least he should be facing a weaker opponent.

Wang Chin-shih has somehow managed to retain his seat for two terms. This is not an overwhelming DPP district like the previous three, but it was already green in 2012 and will probably tilt even greener by 2016. The KMT had a competent candidate in Pingtung, but he could barely manage 40% in this district. Wang should be terrified.

Huang Chao-shun is the only KMT legislator in the south with a reasonable shot at keeping her seat. This district went roughly as green as the entire country in 2012, which was not enough to win the presidency or this seat. However, Huang should probably be alarmed by the unfathomable 63.7% Chen Chu won in this district. Chen won such an enormous victory that it is hard to imagine how it will translate to the next election. Some of those people will certainly go back to the KMT, but some probably will not. Huang needs an awful lot of people to return to the KMT fold in 2016.

Central Taiwan

Ma Wen-chun 馬文君, Nantou 1  (!!)

2012 LY DPP: 38.6%;      2012 Tsai: 40.4%;   2014 DPP: 52.0%

(open seat), Nantou 2  (!!!)

2012 LY DPP: 45.7%;      2012 Tsai: 44.1%;   2014 DPP: 46.3%

Wang Hui-mei 王惠美, Changhua 1  (!!!)

2012 LY DPP: 35.0%;      2012 Tsai: 47.5%;   2014 DPP: 53.8%

Lin Tsang-min 林滄敏, Changhua 2  (!!)

2012 LY DPP: 44.5%;      2012 Tsai: 44.1%;   2014 DPP: 47.9%

Cheng Ju-fen 鄭汝芬, Changhua 3  (!!!)

2012 LY DPP: 44.1%;      2012 Tsai: 48.0%;   2014 DPP: 54.2%

Yen Kuan-heng 顏寬恆, Taichung 2  (!!!)

2012 LY DPP: 40.2%;      2012 Tsai: 45.3%;   2014 DPP: 58.6%

Yang Chiung-ying 楊瓊瓔, Taichung 3  (!!!)

2012 LY DPP: 37.4%;      2012 Tsai: 47.2%;   2014 DPP: 59.5%

Tsai Chin-lung 蔡錦隆, Taichung 4  (!!)

2012 LY DPP: 46.3%;      2012 Tsai: 40.7%;   2014 DPP: 53.3%

Lu Hsiu-yen 盧秀燕, Taichung 5  (!!)

2012 LY DPP: 40.9%;      2012 Tsai: 41.0%;   2014 DPP: 53.2%

Chiang Chi-chen 江啟臣, Taichung 8  (!!!)

2012 LY DPP: 39.5%;      2012 Tsai: 47.1%;   2014 DPP: 58.0%

The DPP won a higher vote share in Nantou 1 this year, but Nantou 2 has always been the better target for them. Nantou 1 has an entrenched incumbent, and Puli is famous for rallying around native candidates. Nantou 2, however, is now an open seat, and without Lin Ming-chen 林明溱 to hold down the fort, it should ripe for the picking. The DPP needs to win this sort of district, in which Tsai Ing-wen got 44% or more, if they are to win an overall majority. Fortunately for them, they will get a shot to win the seat in a by-election, where conditions tend to favor the DPP. Assuming the DPP wins Nantou 2 now, it will have an incumbent defending the seat in 2016 and might be hard to dislodge.

In Changhua, the KMT has three seats, and the Changhua 4 seat has now become open. In the presidential election, Changhua 4 was not the DPP’s best district. Rather, Tsai was slightly stronger in both Changhua 1 and Changhua 3. The KMT incumbents in both of those districts should be extremely concerned. Changhua 2 might be a little different. This has always been a more blue-leaning district, and Lin Tsang-min will be defending his seat. On the other hand, Lin lost his home district in 2014, so he can’t be too confident. My guess is that, if you strip away all the influences of individual candidates, districts 1, 3, and 4 are currently leaning toward the DPP with district 2 just about a tossup. However, candidates matter a lot in places like Changhua, and the KMT will be fielding three incumbents. The DPP might beat them, but they won’t go down without a vigorous fight.

There are eight districts in Taichung which can roughly be divided into two groups. Districts 1, 2, 3, 6, 7, and 8 were all fairly close in both 2012 and 2014. Tsai won about 46% and Lin Chia-lung got about 58% in all of them. The DPP currently holds three of these seats (1, 6, and 7), and it should vigorously contest the other three. The District 8 incumbent, Chiang Chi-chen, seems the most likely to fall, as there have been rumblings that the local factions have not been happy with him. In District 3, Yang Chiung-ying has been in the legislature since 1998, and she was in the provincial assembly for a couple of terms before that. She has very deep connections running throughout the district. However, precisely because she is so deeply entrenched in clientelistic politics, she might be vulnerable to the same sort of wave that drowned Sean Lien and John Wu this year. In District 2, the Yen family seems to be dug in. They managed to transfer the seat from the father to the son in a by-election last year even though by-elections in this political climate tend to overwhelmingly favor the DPP. In a general election, the DPP will have an even harder time overcoming the unique appeal of the Yen family. To unseat them, the 2016 presidential candidate might need to replicate Lin’s 58.6% performance in this district. In both 2008 and 2012, the DPP has utterly failed to challenge Yang or Yen. If they are serious about these seats, they have to find more capable candidates than the cannon fodder they have previously presented to the electorate. It might be that the top quality candidates were scared off because the races looked nearly impossible. That should not be as much of a barrier in 2016.

The other two Taichung districts are much bluer. Lin won Districts 4 and 5 with about 53%, while in 2012 Tsai could only manage about 41%. These are the richest parts of the city, and they also have a higher proportion of Mainlanders than any other district. Even assuming the current anti-KMT wave is most intense in the most urbanized areas, I don’t expect the DPP to be able to take District 5 from Lu Hsiu-yen. Tsai Chin-lung in District 4 looks much weaker. He only won re-election in 2012 by a 54-46 margin, and he will probably face the same strong opponent (Chang Liao Wan-chien 張廖萬堅) again in 2016.

New Taipei City

Wu Yu-sheng 吳育昇, New Taipei 1  (!!)

2012 LY DPP: 42.4%;      2012 Tsai: 42.5%;   2014 DPP: 46.6%

Lee Hung-chun 李鴻鈞, New Taipei 4  (!!!)

2012 LY DPP: 46.6%;      2012 Tsai: 48.8%;   2014 DPP: 54.2%

Huang Chih-hsiung 黃志雄, New Taipei 5  (!!!)

2012 LY DPP: 45.7%;      2012 Tsai: 47.4%;   2014 DPP: 52.5%

Lin Hung-chih 林鴻池, New Taipei 6  (!!!)

2012 LY DPP: 45.9%;      2012 Tsai: 47.1%;   2014 DPP: 52.4%

Chiang Hui-chen 江惠貞, New Taipei 7  (!!!)

2012 LY DPP: 42.8%;      2012 Tsai: 45.9%;   2014 DPP: 51.7%

Chang Ching-chung 張慶忠, New Taipei 8  (  )

2012 LY DPP: 39.8%;      2012 Tsai: 37.5%;   2014 DPP: 43.5%

Lin Teh-fu 林德福, New Taipei 9  (  )

2012 LY DPP: 27.6%;      2012 Tsai: 31.3%;   2014 DPP: 37.1%

Lu Chia-chen 盧嘉辰, New Taipei 10  (!!)

2012 LY DPP: 43.4%;      2012 Tsai: 44.8%;   2014 DPP: 50.1%

Luo Ming-tsai 羅明才, New Taipei 11  (  )

2012 LY DPP: 33.4%;      2012 Tsai: 32.9%;   2014 DPP: 38.3%

Lee Ching-hua 李慶華, New Taipei 12  (!!)

2012 LY DPP: 35.9%;      2012 Tsai: 42.2%;   2014 DPP: 47.0%

KMT legislators from New Taipei have to look at the 2014 results differently than their colleagues from other cities or counties. In New Taipei, the pre-election consensus was that the KMT had an extremely popular candidate running against a lackluster DPP candidate. Eric Chu, with all of his personal popularity, barely survived this election. In places like Kaohsiung or Taichung, it is unlikely that the DPP can replicate such impressive numbers in future elections. In New Taipei, after stripping away the 2014 candidates’ personal influences, the DPP vote shares might actually be too low. Every KMT legislator has to ask him or herself, “Am I as good as Chu and will my opponent be as lousy as You?” The answers aren’t encouraging for the KMT in 2016.

Districts 8, 9, and 11 are safe KMT districts. In 2014, these three districts won the election for Chu. The Xindian Luo family’s seat is far safer than the Yunlin Chang family’s or the Taichung Yen family’s seat. (Quick quiz: What is the common thread tying those three families together?) In Zhonghe, Chang Ching-chung will go down (as a footnote) in history for triggering the Sunflower movement. However, the Sunflowers and their supporters would be wise to direct their energies elsewhere, since the New Taipei 8 seat is unwinnable. KMT supporters might not want to be too happy about having these three safe seats. One of the classic gerrymandering strategies is to pack all of your opponent’s strongest neighborhoods into one district. Assuming the overall balance of power is roughly even, by sacrificing that single district, you can win by a small margin in all the other districts. New Taipei City is a natural DPP gerrymander. If the DPP can get to 50% overall, it will win more than half of the seats. In 2014, even though the KMT won New Taipei by 1.3%, the DPP won 7 of the 12 legislative districts.

Districts 1 and 12 are the other two that Chu won a majority in. In previous elections, these have usually been solidly blue. In 2014 Chu won by a surprisingly small margin, especially in District 12, which is mostly Xizhi. This should serve as a wake-up call to Wu Yu-sheng and Lee Ching-hua. They should probably still be able to win, but it is by no means an automatic victory. After 22 years in the legislature, if Lee doesn’t still have the energy to fend off a serious challenge, this might be a good time for him to triumphantly retire.

Districts 7 and 10 are similar and are right on the border between two and three exclamation marks. They are also adjacent to each other, since Tucheng (D10) abuts the southwestern part of Banqiao (D7). These are also just about the median districts nationally, in that one of them might be the 57th seat for one of the parties. Both of these incumbents are fairly anonymous nationally but have spent a lot of time working the district.

Districts 4, 5, and 6 are the most likely dominos to fall. District 6 (northeast Banqiao) will be particularly interesting. A year and a half ago, Lin Hung-chih might have been my choice as the most likely KMT nominee for New Taipei mayor in 2018. However, the last year and a half have not been good for him. He was the KMT whip during the September Struggle and the Sunflower movement. He did much of Ma’s dirty work in the legislature, and Ma tried to use him to bypass Speaker Wang. After resigning the whip position, Lin complained that he had not wanted to do these things but he was obliged to do what the party demanded. Nonetheless, the DPP will almost certainly try to paint him as Ma’s puppet and ask voters to reject Ma. In past elections, Lin’s personal popularity has masked the fact that his district is by no means solidly blue. In 2016, he should be terrified that his willingness to follow Ma’s orders might cost him what looked like a promising political career.

Taoyuan

Chen Ken-te 陳根德, Taoyuan 1  (!!)

2012 LY DPP: 44.7%;      2012 Tsai: 42.7%;   2014 DPP: 55.6%

Liao Cheng-ching 廖正井, Taoyuan 2  (!!)

2012 LY DPP: 49.8%;      2012 Tsai: 44.6%;   2014 DPP: 51.3%

Chen Hsueh-sheng 陳學聖, Taoyuan 3  (!)

2012 LY DPP: 39.9%;      2012 Tsai: 36.4%;   2014 DPP: 46.9%

Yang Li-huan 楊麗環, Taoyuan 4  (!!)

2012 LY DPP: 40.6%;      2012 Tsai: 41.1%;   2014 DPP: 56.4%

Lu Yu-ling 呂玉玲, Taoyuan 5  (!)

2012 LY DPP: 35.1%;      2012 Tsai: 36.1%;   2014 DPP: 47.0%

Sun Ta-chien 孫大千, Taoyuan 6  (!)

2012 LY DPP (ally): 31.3%;     2012 Tsai: 37.8%;   2014 DPP: 49.0%

This glance at Taoyuan is a reminder of just how unlikely Cheng Wen-tsan’s mayoral victory was. He built his winning coalition on a very weak DPP foundation. One of the most important questions for Taiwan’s future is whether the 2014 election was a one-time freakish event based on the personal failings of John Wu or whether these results reflect real underlying changes in the electorate and can be replicated in the future. My hunch is that future elections will look more like 2012 than 2014, but, as the wag quipped, predictions are always shaky – especially the ones about the future.

In the past, District 2 (coast) has been the DPP’s best by far. In fact, this looked like the only one that the DPP had a realistic shot at. What was interesting about this election was that the DPP’s vote exploded in Districts 1 and 4, the mostly Min-nan areas closest to New Taipei City. In 2012, the KMT incumbent crushed his DPP opponent by over 10%. In 2014, Cheng won D1 by 12%. The strange thing is that the DPP’s candidate in 2012 was none other than Cheng Wen-tsan. If I were Chen Ken-te or Yang Li-huan, I would be shocked and very, very concerned. I would certainly do everything possible to distance myself from the Wu family and President Ma. I would also be talking to as many of my constituents as possible to try to figure out what happened. As much as anywhere in the country, these two seats are ground zero for the wave that just swept over Taiwan. If that wave hasn’t receded by early 2016, these two could be in trouble.

District 6 is a bit like New Taipei 1 and 12. This is a district that I have always considered to be an absolutely safe blue seat, yet the DPP came startlingly close to winning it in 2014. District 6 actually has three distinct parts. Daxi is an older area with far less industry, and its population hasn’t grown as fast as the rest of Taoyuan. In past years, this has been the DPP’s strongest part of the district. Most of the electorate resides in Bade. Bade is somewhat like the fast growing Min-nan areas in Districts 1 and 4, although Bade has always favored the KMT more strongly than either of those two areas. Finally, there are also about 25000 votes from Zhongli. While this is the smallest of the three pieces, it is also the most extreme. These areas of Zhongli are mostly military communities, and they have, in the past, gone for the KMT by as much as 80-20. When I studied the redistricting process from the perspective of the 2004 election, District 6 was the safest of all the Taoyuan districts. In fact, the DPP put the Zhongli military votes with Bade precisely because they thought they had a better chance of winning the remaining (mostly Hakka) areas of Zhongli than winning in Bade. In 2014, Cheng shockingly won Bade by 2%. Wu only won District 6 because of his margin in the Zhongli military areas and the mostly Aboriginal Fuxing district. (I ignored Fuxing since Aborigines vote in separate legislative districts.) Because of the safety net provided by the Zhongli military votes, Sun Ta-chien is unlikely to lose in 2016. Still, he should be jolted by the realization that his district has suddenly become competitive.

I am not going to bother with Taipei City. Ko and Lien had such a strong personal influence on the race that I’m not sure it can tell us much about how voters will decide in 2016.

The DPP has to win 15 more seats. I have marked 14 seats with three or four exclamation marks. If the DPP can move the needle enough to put some of the districts with two question marks into play, they can certainly win a majority. If they can replicate the 2014 result, they will easily win a majority. In fact, they don’t have to do quite that well. The DPP won 50 of the 73 districts (assuming the KMT keeps 7 of the 8 Taipei seats). If you give the KMT all six of the aboriginal seats and split the party list seats 17-17, that produces a 67- 46 DPP majority. Again, I don’t expect the 2016 elections to replicate the 2014 results, but 2014 should be a clear message that the legislative majority is up for grabs.

DPP votes in Aboriginal townships, part 2

December 5, 2014

In a recent post, I pointed out that the DPP received an unprecedentedly high vote share in the 30 predominantly Aboriginal townships. This seems to be evidence that preferences are changing among Aboriginal voters. Even if those votes reflect opposition to the KMT rather than support for the DPP, at least the DPP party label is no longer the ballot box poison that it seemed to be in the past.

In a comment on another post, Joseph Wang offered an alternative hypothesis. Maybe large numbers of Han people are moving into these traditionally Aboriginal townships. The DPP’s higher popularity among the increasingly populous Han residents might be what is driving the overall rise in DPP vote share. This seemed quite a reasonable suggestion to me, so I thought I’d look into it.

There is no way to tell Aboriginal and Han voters apart in the executive elections I looked at in the previous post. However, in legislative elections Aborigines have separate districts, so we can count how many Han and how many Aboriginal voters there are in each township. I looked at the 30 townships with a predominance of “mountain Aborigines” (roughly speaking, all tribes except Amis). This time, I also looked at 5 townships in which at least half of the population was “plains Aborigines” (ie: Amis).

30 mountain 5 plains
Eligible Aboriginal Voters (1992) 93851 27764
Eligible Han Voters (1992) 31921 27162
Eligible Aboriginal Voters (2012) 115473 26066
Eligible Han Voters (2012) 32490 21683
% Aborigine (1992) 74.6 50.5
% Aborigine (2012) 78.0 54.6

It doesn’t seem to be the case that Han migration is driving the trends. The Aboriginal townships have a higher overall percentage of Aboriginal voters in 2012 than they did in 1992. It’s also not the case that individual townships. The biggest drop was in Lanyu 蘭嶼 (8.0%), followed by Namaxia 那瑪夏 (4.1%), Wulai 烏來 (3.8%), Chenggong 成功 (0.5%), and Wutai 霧臺 (0.1%). The other 30 townships all saw the percentage of Aboriginal voters increase.

If the number of Han voters is not increasing, it is certainly possible that their political preferences have changed over the past 20 years (just as in the rest of Taiwan). I have heard one story about Han people in Aboriginal townships countless times over the years. Many (most?) of them are Mainlanders, retired soldiers who married an Aboriginal woman and moved into the Aboriginal community. I don’t know how much truth there is to this stereotype. At any rate, it is possible that the Han population in Aboriginal townships has evolved, either in its demographic composition or simply in its political preferences.

Has the DPP gotten more votes among Han voters in Aboriginal townships over the past 20 years? Again, this can be examined in legislative elections, where Han voters choose from a different set of candidates than Aboriginal voters. The 30 mountain townships are probably a better indicator since they encompass a wide range of electoral districts and are thus far less sensitive to variations in candidate quality. (I don’t think it is advisable to duplicate this methodology among Aboriginal voters since the quality of DPP candidates in those elections varied too widely.)

30 mountain 5 plains
DPP votes (1992) 3416 3281
DPP votes (2012) 7063 4130
DPP vote share (1992) 14.9 19.1
DPP vote share (2012) 25.7 24.8

The DPP has clearly made inroads among Han voters in Aboriginal townships. In the 30 mountain townships, the DPP’s vote share was about 10% higher in 2012 than twenty years earlier. However, remember that only about a quarter of the electorate in those areas was Han. That implies that, if there was no change among Aboriginal voters, the DPP vote share in executive elections should have gone up by only about 2-3% of the past 20 years. The DPP’s increases prior to this year were modest, but they seemed to be more on the order of 5% or so. Han voting might be one part of the changes, but there had to be some changes in Aboriginal voting behavior as well.

All this says very little about the DPP’s huge spike in 2014. That change is so large and so sudden that it simply cannot be explained by changes among Han voters. Aboriginal voters had to have changed as well.

Was it turnout?

December 3, 2014

The CEC has released top-level turnout numbers for the recent elections. They have not yet put the full file online, so we cannot see the sub-district breakdowns. Still, a lot of people have been wondering if turnout drove the unexpected election results. There are some interesting numbers here.

Remember, some places always have lower turnout than others. It is harder for people who live in Taipei to return to Hualien to vote than it is to get to Hsinchu. Also, it matters whether people generally expected the race to be close or not. In this table, I’m listing the turnout for each city and county this year. I also put the 2012 presidential election turnout to indicate whether turnout is naturally lower in a particular place. Finally, I give my subjective opinion of how close the race was expected to be.

  2014 2012 Diff  
Taipei 70.5 76.8 -6.3 A little close
New Taipei 61.7 75.9 -14.2 Not close
Taoyuan 62.7 74.6 -11.9 Not close
Taichung 71.9 75.8 -3.9 Close
Tainan 65.9 74.2 -8.3 Not close
Kaohsiung 66.4 75.9 -9.5 Not close
Hsinchu County 68.8 76.1 -7.3 Not close
Miaoli 72.8 74.6 -1.8 Not close
Changhua 72.9 73.5 -0.6 Very close
Nantou 73.1 71.1 2.0 A little close
Yunlin 74.1 68.9 5.2 Close
Chiayi County 74.2 72.5 1.7 Not close
Pingtung 73.5 72.7 0.8 Not close
Yilan 70.5 72.5 -2.0 Not close
Hualien 61.8 64.6 -2.8 Not close
Taitung 67.8 61.8 6.0 A little close
Penghu 66.3 59.0 7.3 Very close
Keelung City 63.9 72.1 -8.2 A little close
Hsinchu City 62.9 75.7 -12.8 not close
Chiayi City 71.0 73.5 -2.5 A little close
Kinmen 45.2 46.7 -1.5 ?
Lienchiang 67.1 65.8 1.3 ?

This looks very interesting. If the surprises were a results of lots of blue voters staying at home, turnout should be markedly depressed in those surprising areas. The most surprising places were New Taipei, Taoyuan, and Hsinchu City, and those three all had double digit drops in turnout. The other places with high drops (Kaohsiung, Tainan, Keelung, Hsinchu County, and Taipei) were also places where the KMT did particularly poorly. This is very strong evidence in support of the hypothesis that blue voters stayed at home.

However, there is another group of districts where the DPP also did better than expected that did not follow this pattern. Changhua and Chiayi City saw very small drops from 2012, and Nantou, Yunlin, and Penghu actually went up.

The two groups of districts are quite different, and they might be experiencing different phenomena. The larger, more urbanized, mostly northern places might have seen blue voters stay at home, while the more rural, southern places might have seen intense mobilization of potential green voters or widespread conversion of former blue voters to the green side.

Remember, this is all speculation. Many of the big drops also occurred in places that were not expected to be competitive, and that might be the critical factor. If it was, then presumably equal numbers of blue and green supporters stayed at home and turnout did not decisively affect the results. The numbers look important, but without more evidence we shouldn’t jump to firm conclusions.

What happened in Taoyuan?

December 1, 2014

So what the hell happened in Taoyuan? I didn’t expect John Wu 吳志揚 to lose, and no one I have talked to saw it coming either. I went to Cheng Wen-tsan’s 鄭文燦 rally on two nights before the election, and I don’t think anyone there expected it either. It was a rather small event. They had extra seats and a big grassy area with an extra screen just in case more people showed up, but they didn’t even fill the main seating area. I guessed that about 4000-5000 people were there. The atmosphere wasn’t exactly electric. The true believers were there fighting the good fight, but knowing in their hearts that the real battle would have to wait until 2016. When Tsai Ing-wen told the crowd that Cheng would win and asked them (as they do at every rally for every hopeless candidate), “Do you have confidence?” The answer “Yes!” was decidedly halfhearted.

Here, the Light Bulb makes a point. He is really a master on the stump.

SAM_6134

Maybe this is when Tsai asked the crowd who would win.

SAM_6156

Lots of empty spaces where there were supposed to be more people.

SAM_6159

Then on Saturday night, we all watched in disbelief as Cheng took an early lead in the counting. A half an hour later, it dawned on me that we were no longer merely looking at a few strange early reporting ballot boxes, and it was possible that Cheng might win. When the DPP finally lost its lead in New Taipei but Cheng expanded his lead in Taoyuan, my brain nearly went into shock. Rationally, I could see what was happening and tell you that Cheng was going to win, but that simply didn’t make any sense to me.

Let me start by saying that we probably won’t ever be able to decipher exactly what happened because we don’t have data. Taiwan doesn’t allow exit polls, so we will never precisely know the demographics of voters who turned out or stayed at home. The main academic post-election survey won’t cover Taoyuan. Due to budgetary constraints, we simply can’t do a survey in every jurisdiction for local elections. This year, the Taiwan Election and Democratization Survey (TEDS) will study Taipei, Taichung, and Kaohsiung. A week ago, those seemed like a fairly obvious choices. (They are also the ones studied in the last election round, and if you want to look at continuity you can’t change places every cycle.) There will, of course, be telephone surveys, but you can ask far more questions (and far more complicated questions) in face-to-face surveys. Moreover, post-election surveys have the same limitations that pre-election surveys had. If we weren’t reaching the people who made up this anti-KMT wave before the election, how can we be confident we are reaching them after the election? At any rate, the point is that this election result will probably always be something of a mystery.

(You can also believe that losing candidates will use it for the next decade to try to inspire their supporters. “Who cares about the polls? Remember how the polls said Cheng Wen-tsan had no chance? We’re gonna win!”

Still, maybe we can find something in the patterns of votes.

My first reaction was that this result had something to do with ethnic politics. Taoyuan is often divided into a Min-nan north and a Hakka south. A few decades ago, there was some discussion about whether the county should be split into two new counties. That never happened, but the KMT incorporated the ethnic divide into its unofficial rules. The county magistrate always rotated between Min-nan and Hakka. In Legislative Yuan and Provincial Assembly nominations, the KMT was always careful to nominate the appropriate number of Hakka and Min-nan candidates. Those candidates were then expected to campaign in their half of the county, so that Min-nan candidates got almost all of their votes in the north and Hakka candidates were concentrated in the south.

The traditional Min-Ke divide was further complicated by the Mainlander population. Taoyuan is also home to an enormous military presence. Unlike Taipei’s Mainlander population, which was much more diverse (in terms of social status, education, occupation, and income) and was spread out into the regular society, Taoyuan’s Mainlander population was much more concentrated in military villages. The townships with the largest military populations were Bade (north), Longtan (south), Zhongli (south), and Pingzheng (south). In the last two decades, the military has razed almost all of the old military villages. Some of the previous residents are housed in newer military-built buildings, but many have moved out into normal society. The residents of the newer buildings are also not exclusively military families. The units can be bought and sold, so regular people can also move in. As a result, the old segregation of military families from regular society is no longer so prevalent. Still, Taoyuan County – especially the four aforementioned townships – continues to have a disproportionate number of Mainlanders.

Further muddying the picture is that Taoyuan has experienced tremendous population growth over the past three decades. This has diluted the traditional ethnic residence patterns quite a bit. It also continually brings in new voters who are outside the traditional mobilization networks.

Still, this race featured a Min-nan candidate (Cheng) against a Hakka candidate (Wu), so you would expect to see Cheng doing particularly well in the north. In fact, Cheng beat Wu by a margin of 54.6 – 47.2 in the seven northern townships, while Wu beat Cheng 51.7 – 44.4 in the six southern townships. Aha! It’s an ethnic war! Not so fast. For one thing, the same pattern held five years ago, when Wu barely Cheng in the north (49.7-48.7) but swamped him in the south (54.9-42.6). Cheng went up everywhere, not just in the north. Moreover, the north-south gap is baked into the party system. The DPP always does better in the north than in the south. For, example in 2012, Tsai Ing-wen got 41.6 in the north, but only 37.4 in the south. The gap was a bit wider in this election, but there isn’t much evidence for the idea that Cheng won with an unprecedented mobilization of Min-nan voters.

A second idea is that turnout was decisive. Lots of people are comparing the raw numbers of votes with previous elections an claiming that they can see evidence that blue voters stayed home, new voters turned out in droves, or something else. I’ve stared at the data for a few hours today, and I just don’t see it.

The CEC hasn’t released the full file of official turnout data yet. I can approximate the turnout at township levels by looking at the number of eligible voters (which they published a few weeks ago) and adding up the number of valid votes for each candidate. This is only an approximation, since it does not include invalid votes. In this case, it also might be fruitful to look at neighborhood-level data, but that would take a lot of time and we don’t have that data yet anyway.

2009 2014 Increase 2009 2014 Increase
Cheng Cheng Cheng Turnout Turnout Turnout
桃園 Taoyuan (n) 48.4 56.3 7.8 50.1 57.9 7.8
八德 Bade (n) 45.2 50.6 5.4 52.0 62.4 10.4
蘆竹 Luzhu (n) 52.5 57.4 4.9 53.8 59.7 5.9
大溪 Daxi (n) 51.2 55.3 4.1 60.8 63.2 2.4
大園 Dayuan (n) 53.2 56.6 3.4 61.7 65.7 4.0
龜山 Guishan (n) 47.3 53.8 6.5 50.2 58.2 7.9
復興 Fuxing (n) 22.3 27.2 4.9 57.7 74.5 16.8
中壢 Zhongli (s) 39.5 45.6 6.1 54.5 62.2 7.7
平鎮 Pingzhen (s) 41.9 48.1 6.2 51.3 62.5 11.2
楊梅 Yangmei (s) 42.2 45.6 3.4 53.3 61.6 8.3
龍潭 Longtan (s) 38.6 44.9 6.4 54.3 61.1 6.8
新屋 Xinwu (s) 55.0 53.6 -1.4 66.1 72.2 6.2
觀音 Guanyin (s) 56.9 55.3 -1.6 61.3 69.4 8.1
.
total 45.7 51.0 5.3 53.7 61.5 7.8

One idea is that hard-core deep blue voters were disgusted with Ma’s performance and simply stayed at home. The overall (estimated) turnout in Taoyuan was rather low, at 61.5%, so many people did not vote. However, it was even lower in 2009 (53.7) when the KMT won. Looking at the township level, if the deep blue voters didn’t turn out, the effect should be biggest in the places the KMT is strongest. Alternatively, it could be the opposite. Perhaps only the deeply committed KMT voters turned out, and the less committed stayed at home. (Ignore Fuxing. It is an aboriginal township, and the patterns may be completely different. It also is tiny, so it can’t be driving the overall patterns.) Cheng is weakest in Zhongli, Pingzhen, Yangmei, and Longtan. However, the turnout increase is just about at the overall average in three of these, and it is a bit higher in Pingzhen. Cheng’s support increased a bit more than average in three of them, but in increase quite a bit below average in the other (more on that later). There doesn’t seem to be support for this hypothesis (or its opposite).

The Mainlander/military presence also doesn’t seem to be driving things either. Three of the four military townships overlap with the strong KMT townships. Trading Bade for Yangmei doesn’t produce any clear patterns.

Maybe someone with sharper eyes than mine can find something in the turnout numbers, but I just don’t see anything. This is not a surprise to me. In the days before every election, pundits scream that turnout will be decisive. They make amazingly precise predictions. If turnout drops below 65%, the DPP will win for sure. If it is over 68%, the KMT will definitely win. Or maybe it’s the other way around. Everyone has a guess about how turnout will affect the race, but they often have very different stories and come up with very different conclusions. The problem is that all these stories require heroic assumptions about what kind of people are ambivalent about voting, and there is no evidence for these assumptions. Many of them are based on nothing more than wishful thinking. After two decades of staring at data, I have never been able to find any consistent effect of turnout.

I do see one interesting pattern in the election results. Comparing Cheng’s vote share in 2009 and 2014, the two southern coastal townships stand out. Cheng actually got more votes in these two townships in 2009 than in 2014. Moreover, the next smallest increases are in neighboring Dayuan and Yangmei townships. Something about Xinwu and Guanyin townships is different, and that may be the key to understanding what happened in Taoyuan this year.

Two possibilities come to mind. First, the coastal areas are traditionally the DPP’s strongest areas. Second, the southern coast is the least industrialized part of Taoyuan. In my previous post, I pointed out that the national wave was larger in northern and central Taiwan and smaller in the rural parts of southern Taiwan. Here we are seeing the same thing. Just to corroborate this point, the next smallest increase is in Daxi, which is another corner of Taoyuan relatively less affected by industrialization and fast population growth and which traditionally is one of the DPP’s better areas. The biggest increases are in Taoyuan and Guishan townships, where much of the recent population boom has been centered.

It is going far beyond the data to speculate why we are seeing this pattern. It could be anger over food safety, which might be a non-partisan middle class issue. It might be something about urban class conflict. It might have something to do with the Sunflowers. However, I’m becoming more and more certain that the answer has to have something to do with city life.

DPP vote share in Aboriginal townships

November 30, 2014

This election keeps surprising me. Looking through the results today with a few Aboriginal friends, we stumbled on another “Holy crap, dude!” finding.

As everyone knows, the DPP has never done well among Aboriginal voters, to put it kindly. In recent years, the DPP has slowly started to make small inroads into this demographic. Usually you can draw a direct connection to growth in the DPP’s vote share and control of a national or local government. Since the DPP doesn’t control the national government and only controlled a few local governments (all of which they had already controlled for significant periods of time and thus had presumably already picked all the low hanging fruits), this election cycle didn’t seem too promising.

One consistent trend is that the DPP has always done better in local mayoral/magistrate elections than in national presidential/gubernatorial elections.

I looked at the DPP vote share in 30 primarily Aboriginal townships around Taiwan. This is by no means a perfect measure of Aboriginal voting patterns. For one thing, it almost completely ignores Amis voters, who generally live in townships with majority Han populations. If you have extremely good local knowledge, you can separate the Amis villages from the Han villages, but that is beyond my knowledge and would take a lot of time. This also ignores the Aborigines who live in urban areas. Nonetheless, this may provide important evidence of the actual underlying trend. Here are the aggregate DPP vote shares in the 30 Aboriginal townships for local and national elections over the past two decades.

aborigines DPP vote growth pre 2014


Look at the blue line for national elections first. If you ignore the peaks and valleys, you can see that the overall trend is a very slow increase. Now look at the red line for local elections. Again, if you ignore the peaks and valleys, it looks very similar to the national trend, except that it is about 10 points higher. Now look at the same chart with the 2014 data added:

aborigines DPP vote growth


This is an enormous leap into uncharted territory for the DPP. Moreover, this is the first major increase where I can’t point to DPP control of a national or local government.

I can’t say with any confidence what is happening. The obvious guess is that Aborigines, like the rest of the Taiwanese population, are fed up with the Ma government, and many previous supporters have voted for the DPP in protest. It will be interesting to see if the DPP can hold this support in the future.  Regardless, it is jarring to see the DPP win over a third of the votes in Aboriginal townships.

geography of the swing

November 30, 2014

As we wake up this morning, we are still trying to figure out where the hell that tidal wave that blindsided us last night came from. The polls gave us fair warning about some of the races. The Taipei result was clearly within the realm of possibility. I actually scribbled down a few back-of-the-envelope numbers a few days ago for Sean Lien’s vote share and came up with 41%. Of course, I didn’t believe that and I actually put down 44.5% for our office prediction pool, but the point is that you could have seen that result from the polling data. Similarly, Keelung City wasn’t a big surprise, and I wasn’t shocked that the DPP easily won in Yunlin or that the Nantou race ended up being pretty close. Some of the other results, though, simply came out of the blue. In particular, Taoyuan and Hsinchu City were complete shocks. I hadn’t seen any hints that those races might even be competitive. Taichung City, Changhua, Chiayi City, and New Taipei City were surprising to me, though not as unfathomable as Taoyuan and Hsinchu City. In general, the pre-election polls simply didn’t prepare us for yesterday’s results. So what did the polls completely miss?

The simplest answer is that many undecided voters made up their mind at the last minute to vote against the KMT. I have serious doubts about this, but there is no way to test this hypothesis with the data available right now. The KMT should hope that this was simply lots of last-minute decisions, since that would imply that the wave against the KMT was rooted in very shallow disapproval and could easily be reversed by 2016.

I suspect what may have happened is the emergence of the new economic cleavage as a powerful electoral force. I see two big groups of people who might have been vastly underrepresented in the surveys: younger people who have completely cut their landline connections and lower-wage labor who rent apartments in one district but vote in another. We have good reasons to believe that both of these groups are especially dissatisfied with the current government, so it is plausible that they were the bulk of the surprise wave. Of course, this will need a lot of testing before it is anything more than mere speculation.

Let’s look at the wave to see a few trends. I’m comparing the KMT’s performance in yesterday’s elections to the KMT’s 2012 presidential vote share. I know that comparing presidential votes to mayoral votes is like comparing apples to oranges, so don’t bombard me with complaints about this. The purpose of using the presidential vote as a baseline is precisely to strip away the local factors to see what the partisan balance used to be. The difference between the two elections is a combination of (1) the national wave and (2) the local factors specific to that race.

I usually look at things from the DPP’s point of view because that usually provides a clearer picture. In this election, however, I think it is more appropriate to look at things from the KMT side. For one thing, I think that this was almost certainly an anti-KMT wave driven by dissatisfaction with the national government rather than a pro-DPP wave driven by widespread attraction to the DPP and its platform. For another, the KMT only had one serious split (Keelung) while the DPP arguably had three (Changhua, Hsinchu City,and maybe Miaoli).

The six direct municipalities are the least localized of the races. If we see national forces acting on the existing partisan structure, it should be most evident in these races. So in the six direct municipalities, here is how the KMT fared:

City 2012 president 2014 mayor Increase
Taipei 57.9% 40.8% -17.1%
New Taipei 53.7% 50.1% -3.6%
Taoyuan 57.2% 48.0% -9.2%
Taichung 52.2% 42.9% -9.3%
Tainan 39.8% 27.1% -12.7%
Kaohsiung 44.2% 30.9% -13.3%

Taipei City is by far the worst, but we expected that. Sean Lien was a special disaster, and the blue coalition broke apart in Taipei in a way that it did not anywhere else. In Tainan and Kaohsiung, extremely popular DPP incumbents were running against weak challengers. Here, the KMT dropped about 13%. In Taichung and Taoyuan, we had KMT incumbents running for re-election. In these two races, the KMT dropped 9%. New Taipei City is the obvious outlier. Eric Chu was also a KMT incumbent running for re-election, but the KMT vote in New Taipei dropped less than 4%. It was very surprising to many people (including me) that Chu made such a proud and aggressive victory speech last night. This is why. He can point out that he alone withstood the wave and, due to his personal popularity, held onto almost all of the previous KMT coalition. Even with his surprisingly narrow margin of victory, he is a clear winner in this election.

Another interesting facet of this wave is that it was much more powerful in the north than in the south.

City 2012 president 2014 mayor Increase
Taipei 57.9% 40.8% -17.1%
New Taipei 53.7% 50.1% -3.6%
Keelung 59.3% 43.7% -15.6%
.
Taoyuan 57.2% 48.0% -9.2%
Hsinchu City 57.4% 37.9% -19.5%
Hsinchu County 65.8% 46.9% -18.9%
Miaoli 63.9% 46.6% -17.3%
.
Taichung 52.2% 42.9% -9.3%
Changhua 50.6% 39.6% -11.0%
Nantou 54.6% 51.0% -3.6%
.
Yunlin 41.7% 43.0% +1.3%
Chiayi City 46.3% 45.5% -0.8%
Chiayi County 39.0% 34.0% -5.0%
Pingtung 42.9% 37.1% -5.8%
Penghu 49.8% 44.7% -5.1%
.
Yilan 44.9% 36.1% -8.8%
Hualien
Taitung 39.8% 27.1% -12.7%
Kinmen
Lienchiang

(Note: In Keelung, I included the votes for Huang Ching-tai and the official KMT nominee in the KMT’s vote share. I left off Hualien, Kinmen, and Lienchiang because those races did not run on party lines at all.)

In the north, there are specific local factors that depressed the KMT’s vote in nearly every race. Still, there was almost certainly a national effect underneath the local effects. The Taoyuan swing of -9% might be a fairly representative effect. In central Taiwan, both Taichung and Changhua also saw roughly 10% swings. However, once you get to southern Taiwan, things look different. Put aside Tainan and Kaohsiung (and their highly popular incumbents seeking re-election), and look at the mostly rural and more heavily agricultural south. The standard swing seems to be only about 5%, or about half that of northern and central Taiwan. I don’t want to cut things too fine here, but the crude pattern of a bigger swing in the north than in the south seems evident to me. (The fact that the KMT is stronger in the north and therefore has more votes to lose doesn’t account for the difference. If you divide the swing by the KMT’s 2012 vote share, the swing is still larger in the north than in the south.

Why? Again, these are all guesses at this point. I wonder if this has to do with urban labor forces. I think this pattern is compatible with the idea that the crucial group withdrawing support from the KMT is the lower income, renting, predominantly younger, wage labor or low-salaried labor force.

(Isn’t it intellectually thrilling to be bewildered!)

First reactions

November 29, 2014

As I write, the broad outlines of this election are coming into focus. At first glance, this is a tremendous loss for the KMT. The DPP is winning all the races that were supposed to be close by large margins, and the KMT is barely eking out victories in areas that it was supposed to win handily. It looks as if Eric Chu will barely survive, but John Wu will suffer an unthinkable upset loss in Taoyuan. The KMT will barely break 50% in Miaoli, and they might even lose Hsinchu City. Even without candidates in Taipei City, Hsinchu County, and Hualien County, the DPP might get more votes nationally than the KMT. This is simply stunning.

We are seeing a national wave of voters withdrawing previous support from the KMT. There are individual stories in each race, but the national trend is clearly against the KMT. What’s more, this is a trend that did not show up in pre-election polls. (Indeed, there was a huge mess of rumors claiming that various unpublished polls had showed the KMT closing the gap in Taichung City.) The easiest inference is that the wave of young voters came out overwhelmingly against the KMT. Young voters often do not reside in the place where they vote, so they might not have been counted in pre-election polls. Many people will attribute the result to Sunflower students going home in droves to vote, and they might be correct. However, this wave is so large that it might be more than that. It seems that people who were undecided broke against the KMT in the last few days. It could be that they were simply silent all along, or it could be that many of them made similar decisions in the last few days.

What is clear is that my earlier insistence that Sean Lien’s problems were all personal was missing a big part of the picture. I suggested that if the KMT lost Taoyuan, that would be a good indicator that something deeper was happening in Taiwan. Well, something deeper has happened.

More to come.